 Victoria Bazir

Solana is flashing a market structure that looks almost identical to its 2022 bull trap, and traders are getting nervous. After topping out near the $240-$260 range in 2025, price is now sliding toward the $80-$90 zone - a setup that closely mirrors the failed breakout pattern that preceded a 96% collapse in the previous cycle. Crypto analyst Crypto Lens flagged the structural parallel, noting the uncanny resemblance to how that earlier breakdown began.
2025 Top Echoes the 2021 Peak Rejection
The weekly chart lays out the comparison clearly. After the 2021 top, SOL collapsed all the way to deep historical demand zones near the long-term trendline.
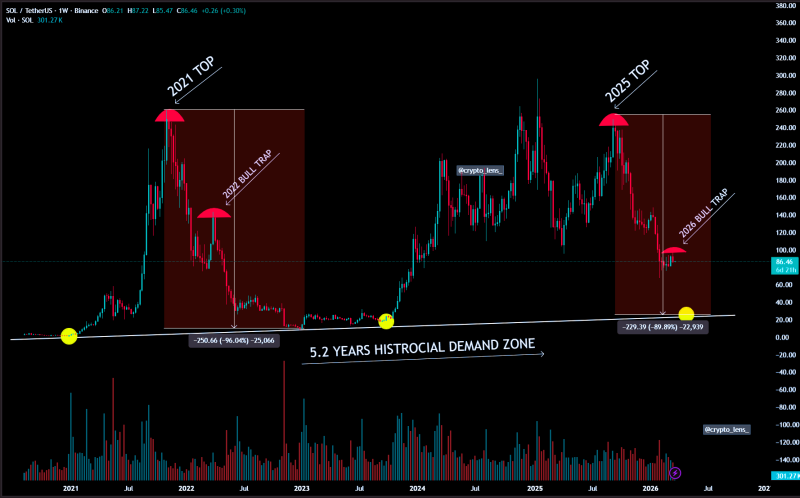
Now, following rejection from 2025 highs, a similar "2026 bull trap" formation is taking shape - with price already breaking lower. Earlier analysis of Solana Tests Multi-Month Trendline With $50 Price Target Looming identified a comparable breakdown risk, warning that losing key support could open the door to significantly lower levels.
$25 Target Aligns With Long-Term Demand Trendline
The chart projection points toward a potential move to the $25 region - the lower boundary of the multi-year demand trendline and a historically significant support area. While the current drawdown hasn't matched the 96% severity of 2022 yet, the structure suggests more downside is possible if the pattern continues to develop. SOL Price Analysis: Solana Shows Early Bounce From $76-$90 Demand Zone captured an early attempt to stabilize in this area, though recovery signals remain fragile at best.
The broader implication goes beyond SOL itself. If this cycle rhyme plays out, it may signal a wider reset phase across altcoins, with Solana acting as a sentiment barometer for overall risk appetite. SOL Price Analysis: Solana Tests $105 Resistance as Traders Watch for 5-Wave Breakout Signal highlighted the uncertainty still hanging over price action within this broader corrective phase - and for now, the bears appear to hold the edge.
 Victoria Bazir


