 Alex Dudov
⬤ Solana (SOL) is trying to find its footing after getting hammered in the recent selloff. Right now, it's trading sideways around $105, stuck beneath some important resistance levels. The big question everyone's asking: is this bounce for real? We need to see a proper five-wave move higher before we can say the worst is behind us. The 30-minute chart shows SOL bouncing back from below $100 and now hanging out in consolidation mode.
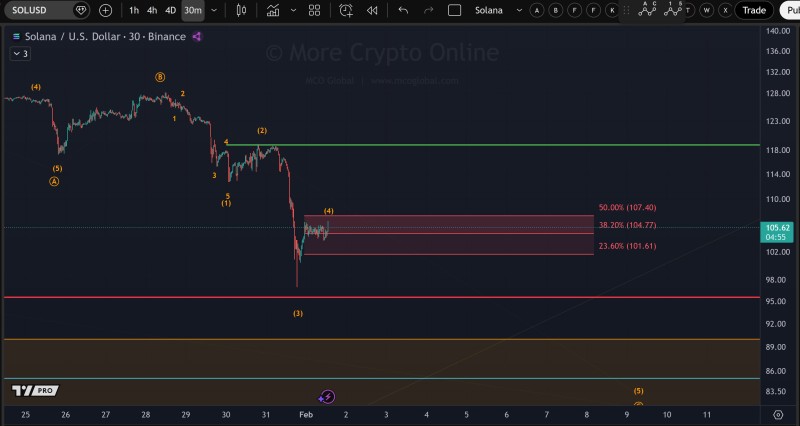
⬤ Here's what went down: Solana was cruising above $120 before things fell apart fast, dropping all the way to the mid-to-high $90s. Since then, it's managed to recover some ground but hasn't really committed to a direction. The chart shows Fibonacci retracement levels that line up with resistance zones at $101.60, $104.77, and $107.40. Above that, there's a more serious wall around $118 that SOL would need to break through for any meaningful rally.
⬤ The technical picture here is all about waiting for confirmation rather than jumping the gun. That five-wave pattern traders are watching comes from Elliott Wave theory—basically, you need to see a complete impulsive structure before you can trust that a trend is actually reversing. Right now, the price action looks choppy and corrective, which means we haven't gotten that confirmation yet. There's still a real chance this bounce is just a breather in a bigger downtrend.
⬤ For the broader crypto market, what happens with Solana matters. It's one of the major players, and during volatile periods like this, people watch it closely for clues. If SOL manages to punch through resistance with that five-wave breakout, it could signal improving momentum across the board. But if it keeps spinning its wheels or gets rejected at these levels, the uncertainty continues. With price sitting right below these technical barriers, Solana's next move could tell us whether this recent beating is turning into a bottom or if there's more pain ahead.
 Alex Dudov


