 Marina Lyubimova
⬤ SOL has been showing signs of stabilization after a rough stretch of downward pressure and sideways movement. The token followed a clean downtrend on the 4-hour chart before entering a consolidation range. Now, early signals point to a reaction from a key demand area, with selling pressure starting to ease.
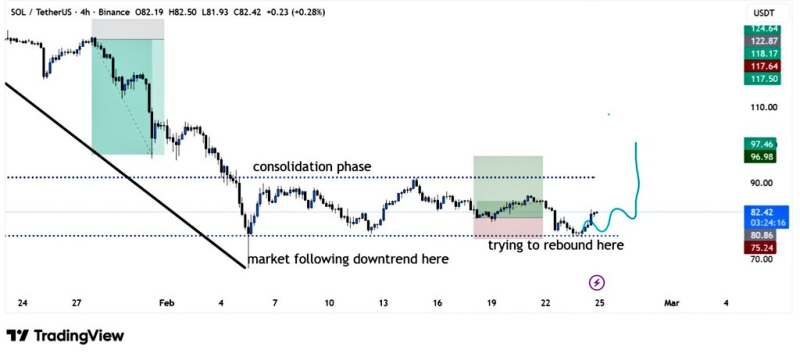
⬤ The SOL/USDT chart tells a clear story: a steady decline from late January into early February, then a period of tight-range consolidation. Price eventually found footing near a well-defined demand zone, and while broader directional conviction is still uncertain, traders watching this pattern have reason to pay attention. According to SOL Trades in $76-$90 Range as Breakout Toward $100 Draws Closer, the token has been grinding within this band with growing breakout potential.
Price is reacting from the demand zone - early signs of a rebound are forming as sellers lose strength.
⬤ If the early rebound holds, the chart's forecast path points to potential upside above the consolidation range. This lines up with technical research from TheTradable - Solana Hits $81 After 100% Extension Target, With $76.50 Now a Critical Level - highlighting how recent price levels have triggered key technical signals that traders are closely tracking.
⬤ The bigger picture shows a market caught between correcting lows and trying to rebuild structure. Short-term bounces can happen within consolidation, but a real recovery depends on SOL breaking above the resistance levels capping price action. Momentum is in transition - from sellers to cautious buyers - and the coming sessions will be telling. As covered in Solana's Weekly RSI Hits December 2022 Lows While Price Holds $84 Support, the macro technical backdrop adds another layer of pressure worth watching closely.
 Marina Lyubimova


