 Marina Lyubimova
⬤ Solana is sitting right on top of a major support line that's been holding things together since 2023. On the three-day chart, SOL is trading around $121, and this rising trendline has been the go-to bounce zone for every significant rally over the past couple of years. If this level doesn't hold, technical analysis points to $50 as the next realistic stopping point on the way down.
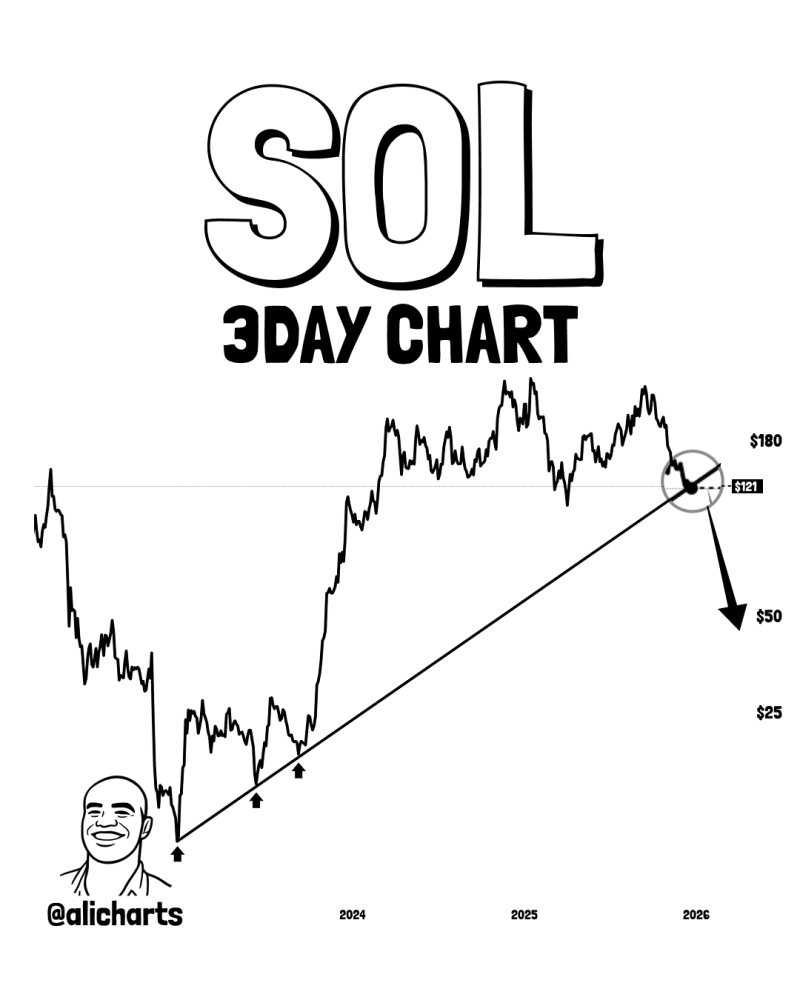
⬤ The chart tells a pretty clear story: every time SOL touched this trendline before, it kicked off a decent move higher. The most recent peak hit near $180 before momentum cooled off and price drifted back down toward the same support. Now we're back at that line again, and the question is whether buyers will show up one more time or if this is where the structure finally gives way.
⬤ Looking at the bigger picture, $50 marks the primary downside target if support breaks, while $25 sits further below as a deeper historical reference point. On the upside, $180 is still the level to beat. Solana has basically been trading in a wide channel for two years now, with this trendline acting as the dividing line between bullish continuation and a more serious correction.
⬤ This isn't just another random support test. Solana is still one of the heaviest hitters in crypto by market cap, and how it handles this level could set the tone for the next few months. A bounce here keeps the 2023 structure alive. A breakdown flips the script entirely and opens the door to much lower prices. All eyes are on how SOL behaves around $121 in the coming weeks.
 Marina Lyubimova


