Peter Smith

⬤ Solana is stuck in a tight trading range on the two-hour chart, bouncing between well-defined support and resistance zones. Price keeps reacting at the same horizontal levels—support around $129-$130 and resistance near $134. This back-and-forth movement shows short-term indecision, with neither buyers nor sellers gaining control yet.
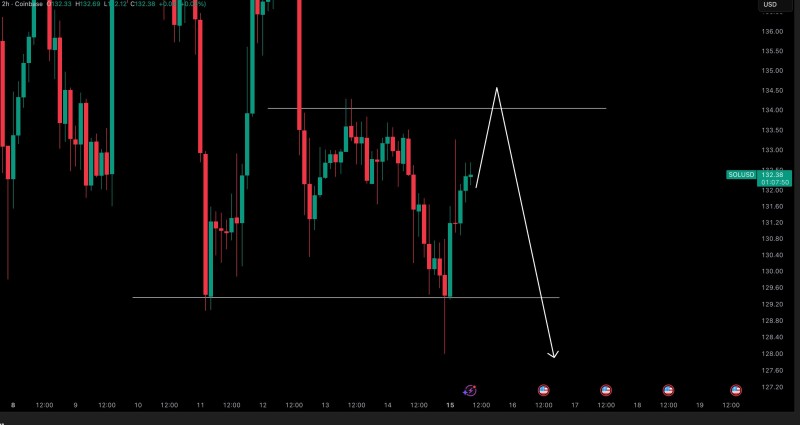
⬤ The chart shows a recent drop to range support followed by a quick bounce back toward the middle. Despite this recovery, SOL hasn't managed to push above the upper boundary. Multiple rejections near $134 confirm this level as a tough ceiling. Until price breaks above it, we're still looking at consolidation rather than any real trend.
⬤ The $134 level is the key test for bulls. If SOL reaches this zone, it'll be back where sellers have consistently pushed price down before. At the same time, dips toward support keep attracting buyers, proving the range is still valid. This balanced action means no side has taken control—yet.
⬤ This matters for the broader crypto market because Solana is one of the most traded altcoins across major exchanges. When consolidation phases like this end, they usually lead to bigger moves. Whether SOL breaks above $134 or stays stuck in this range could shape short-term momentum across the altcoin space, as traders watch for the next clear direction.
 Peter Smith