 Saad Ullah

⬤ Solana was trading near $132.90 on Saturday as price action squeezed into a tightening pattern following recent swings. The daily trend for SOL stays bearish, and the lower-timeframe setup is now lining up with that bigger picture. The one-hour chart shows a textbook bearish pennant taking shape after a sharp drop, pointing toward more downside ahead.
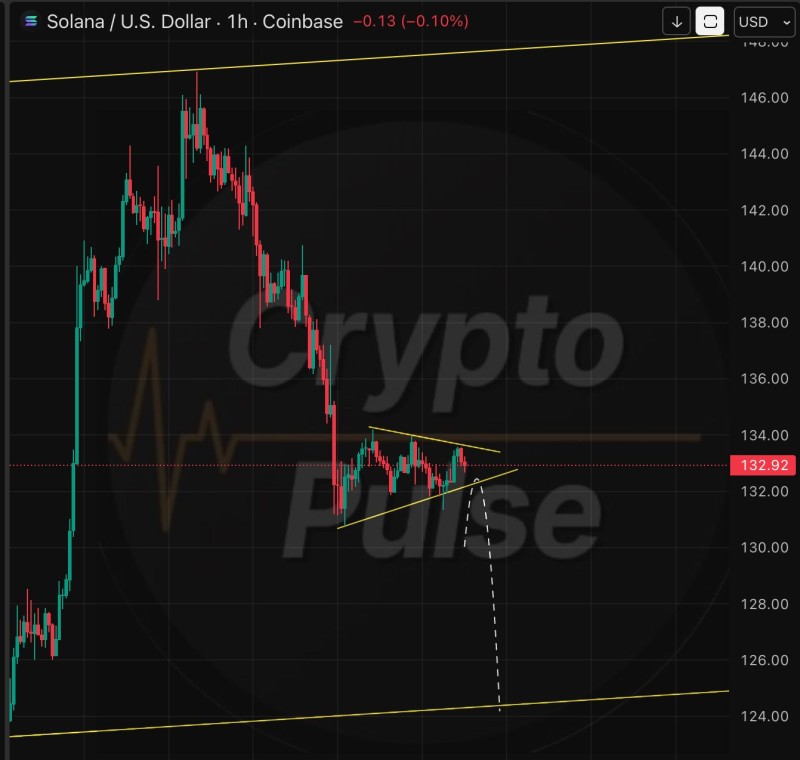
⬤ Over recent sessions, Solana has been bouncing between roughly $131 and $134 while printing lower highs. This squeeze backs up the pennant structure and shows fading momentum after losing key support zones in recent weeks. The chart also maps out a potential move toward the $124 zone, which matches the next major support sitting at $124.40. The combo of the daily downtrend and this lower-timeframe pattern gives sellers double confirmation.
⬤ The trade plan calls for a short entry only if SOL cracks below $131.70 with a solid hourly close. That would confirm the bearish pennant and unlock the path toward the $124.40 target. Until that level gives way, this stays a consolidation rather than an active breakdown, though the market still leans toward more downside.
⬤ This matters because Solana hasn't been able to catch a bid since peaking back in July. A confirmed pennant breakdown would add fuel to the bearish sentiment and could drive fresh volatility as traders react to the structural weakness. How SOL handles $131.70 will decide whether the downtrend picks up speed or finds some stability in the short term.
 Saad Ullah


