 Saad Ullah
Solana is edging lower after a failed recovery attempt, with price now approaching a clearly defined support level that has become the focal point for traders. The current setup reflects a market still leaning downward, and expectations are building that a deeper dip may come before any real bounce develops.
The Breakdown That Shifted SOL Control
The 4-hour chart tells a straightforward story. After peaking near the mid-$90s, SOL/USD started forming lower highs, a clear sign that upside momentum had dried up. A horizontal resistance zone near $93-$94 rejected the last rally attempt, confirming that sellers were in charge at elevated levels.
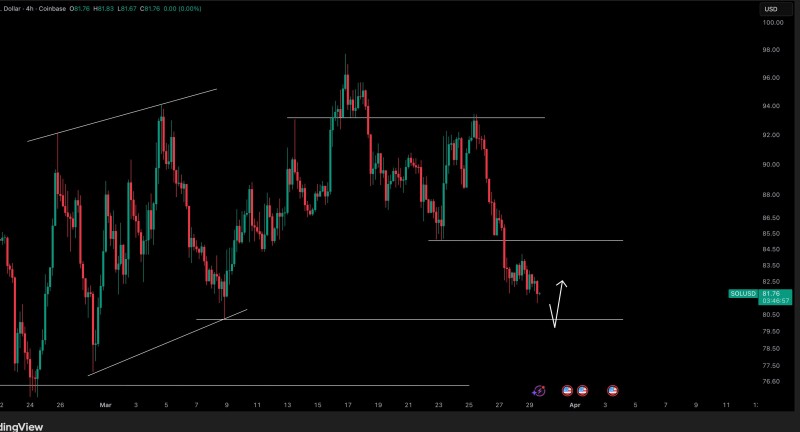
From there, price moved lower and broke below a mid-range support area, accelerating the slide. What was previously a balanced range evolved into a descending pattern, with sellers pushing back on every bounce attempt and keeping the structure firmly tilted to the downside.
The market continues to show signs of seller control on each recovery attempt, with lower highs forming across the structure and no meaningful break back above resistance.
$80 Support Zone Now Under Pressure in Solana Price Action
As Crypto Tony noted, the market is still waiting on the dip - and the chart reflects exactly that kind of positioning. Price is now hovering just above a key horizontal support zone near $80-$81, a level that stands out for several reasons:
- It aligns with prior consolidation lows visible on the chart
- It acts as the next clear downside target after the recent breakdown
- It remains untested following the most recent leg lower
The projected path on the chart suggests a brief move below this level before a potential reaction higher, indicating that liquidity may be sitting just beneath support. That kind of setup often precedes a sharp short-term reversal once the sweep is complete. For broader context on how this level developed, SOL Price Tests $80 as Breakdown Risk Builds covers the technical buildup in detail.
Price is now hovering just above the $80-$81 zone - a level that has repeatedly attracted attention and remains untested after the latest leg lower.
SOL Compression Signals Next Move Building
Recent candles show a clear slowdown in momentum as price approaches support, with smaller bodies forming after the sharp decline. This kind of compression often appears when the market is preparing for a reaction rather than continuing straight down. SOL Price Analysis: Solana Tests $105 Resistance as Traders Watch for 5-Wave Breakout Signal shows how similar compression preceded the earlier directional move.
Smaller candle bodies near key support often signal that a decision point is approaching - either a flush lower to clear liquidity or a base forming ahead of a recovery.
Similar behavior has been observed in prior Solana price cycles, where price consolidates near support zones before picking direction, particularly around critical levels like $80. Solana Mirrors 2022 Bull Trap Pattern - $25 Price Risk Emerges draws parallels to earlier structural breakdowns that followed comparable setups.
At this stage, the structure remains bearish in the short term, with no confirmed shift back to higher highs. Until that changes, the technical picture suggests the market is still leaning toward a deeper test of support before any sustained recovery attempt emerges.
 Saad Ullah


