Eseandre Mordi
Solana's latest recovery is running out of steam right where it matters most. After sweeping liquidity near $79, SOL bounced back into the $84 area - but the price action at that level tells a familiar story: buyers show up, sellers push back harder. Crypto analyst Nehal flagged the setup, noting that the inability to secure acceptance above $84-$85 keeps the market exposed to a downside rotation.
SOL Rejected at $84-$85 Resistance Zone 3 Times
The chart tells a clean story. A liquidity sweep below $79 was followed by a recovery into resistance - a pattern that typically traps short sellers and fuels a temporary bounce. That bounce arrived on schedule. The problem is what happened next.
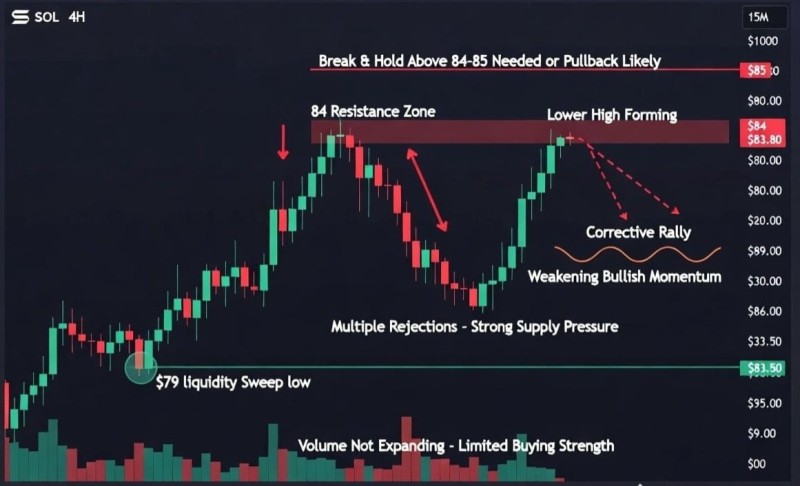
Price pushed into the $84 resistance zone and stalled. Not once, but multiple times. Each attempt to break higher was quickly absorbed by sellers, leaving a series of visible rejections at the same level. That kind of repeated failure at a single price point is hard to ignore - it signals strong supply overhead and a market that is not yet ready to move higher.
Lower High Structure Points to Weakening Bullish Control
The bigger structural problem is what SOL is doing between those rejections. Rather than reclaiming prior highs, price is printing a lower high directly beneath resistance. That shift matters.
A lower high in this context means buyers are stepping in earlier and earlier - not because they are confident, but because they cannot push price far enough to challenge the ceiling. The sequence is telling: rejection, compression, another failed attempt. Each cycle tightens the range and chips away at bullish momentum. SOL has previously traded within defined ranges where resistance dictated direction, and the current setup echoes that pattern.
Price fails to extend higher and begins compressing below resistance - buyers are losing control of the short-term structure.
Volume Divergence Confirms the Move Is Corrective, Not Impulsive
One of the clearest warning signs in the current setup is the volume picture. Strong breakouts come with expanding volume - broad participation, conviction behind the move. What the chart shows here is the opposite.
The move is corrective rather than impulsive - price rises, but volume does not follow.
Price rises during the recovery phase, but volume does not follow. That divergence is a red flag. It suggests the bounce is corrective rather than impulsive - a retracement within a broader weak structure, not the start of a fresh leg higher. Without volume behind it, the rally has a limited runway. Drifting price action near key support levels has previously triggered further dips before any meaningful recovery.
$84-$85 Remains the Line That Defines the Outcome
Everything in this setup points back to one level. The $84-$85 zone has acted as a ceiling repeatedly, and the market continues to respect it as resistance rather than treat it as a launchpad. Until that changes, the structure favors the bears.
The combination of factors at play - liquidity sweep, corrective rally, lower high formation, and weak volume - aligns with a market that is struggling to hold upward momentum. A confirmed break and close above $84-$85 with follow-through volume would invalidate the bearish read. The $78-$95 range has been a key battleground for Solana, and the outcome of the current test at resistance will likely determine the next directional move.
Until that breakout happens, the path of least resistance points lower.
 Eseandre Mordi