 Saad Ullah

Shiba Inu is sitting at a critical technical level, with price action compressing tightly against long-term support while overhead resistance continues to weigh on structure. According to CRYPTO SHIB, expectations are building around a potential explosive move - but the chart itself shows a market still locked in a broader downtrend.
SHIB Weekly Chart Shows Pattern of Lower Highs Since 2021
The weekly chart reveals a clear pattern of lower highs stretching from the 2021 peak into 2026. A descending trendline continues to cap every major rally attempt, reinforcing persistent selling pressure over time.
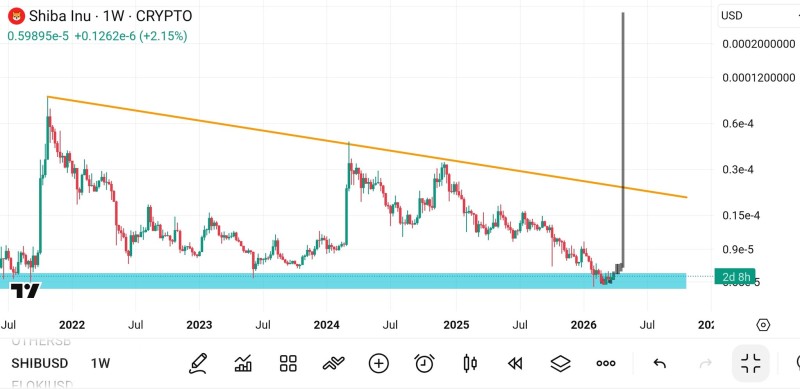
Even the strongest bounce in 2024 failed to break above this trendline, instead forming another lower high before rolling over.
Similar setups have historically acted as launchpads for strong moves, with past rebounds from key support triggering large rallies in SHIB's price history.
This confirms that the long-term structure remains bearish, with SHIB tightening its range as Bollinger Bands signal a breakout and resistance steadily pushing price lower.
A Support Zone That Has Held Multiple Tests
At the same time, SHIB is trading directly within a clearly defined horizontal support zone that has been tested multiple times across several years. This area has consistently acted as a floor, with buyers stepping in each time price revisits it.
The current candles show tight consolidation just above this zone, suggesting a pause in selling rather than a confirmed reversal.
The current structure reflects a market still in compression, not expansion.
For context, SHIB's price history includes a 1,237% rally after testing this same support level - a precedent that keeps traders watching closely.
SHIB Price Compression Signals a Larger Move Ahead
The most notable feature of the chart is the narrowing range between descending resistance and horizontal support. Price is being squeezed into a tightening structure, reducing volatility over time.
- Lower highs continue to press downward
- Support remains intact but repeatedly tested
- Price action is compressing into a smaller range
This kind of setup often precedes a breakout phase, as volatility contraction tends to lead to expansion once a boundary is broken. Some traders are already eyeing a potential 156% SHIB rally after key breakout signals emerge on the chart.
A Structure Waiting for Resolution
The chart does not yet confirm direction. For a bullish breakout, SHIB would need to close above the descending trendline that has defined the entire structure since the 2021 peak.
Until that happens, price remains constrained between support and resistance. While speculation around large upside moves continues, the current setup reflects a market in a waiting phase. If support continues to hold, the pressure building within this range could eventually resolve into a strong move - but for now, SHIB remains tightly coiled, with the next decisive break likely to define its next phase.
 Saad Ullah


