 Victoria Bazir

A prolonged decline in PEPE may be approaching a pause, with early signs of stabilization emerging on the weekly timeframe. Analysis from Ali Charts suggests that selling pressure could be exhausted, opening the door for a short-term rebound toward higher levels.
The Downtrend That Shaped PEPE's Current Structure
The weekly chart shows a clear sequence of lower highs and lower lows, confirming a sustained downtrend from late February into March. Each rally attempt failed to break prior highs, reinforcing bearish control over the asset.
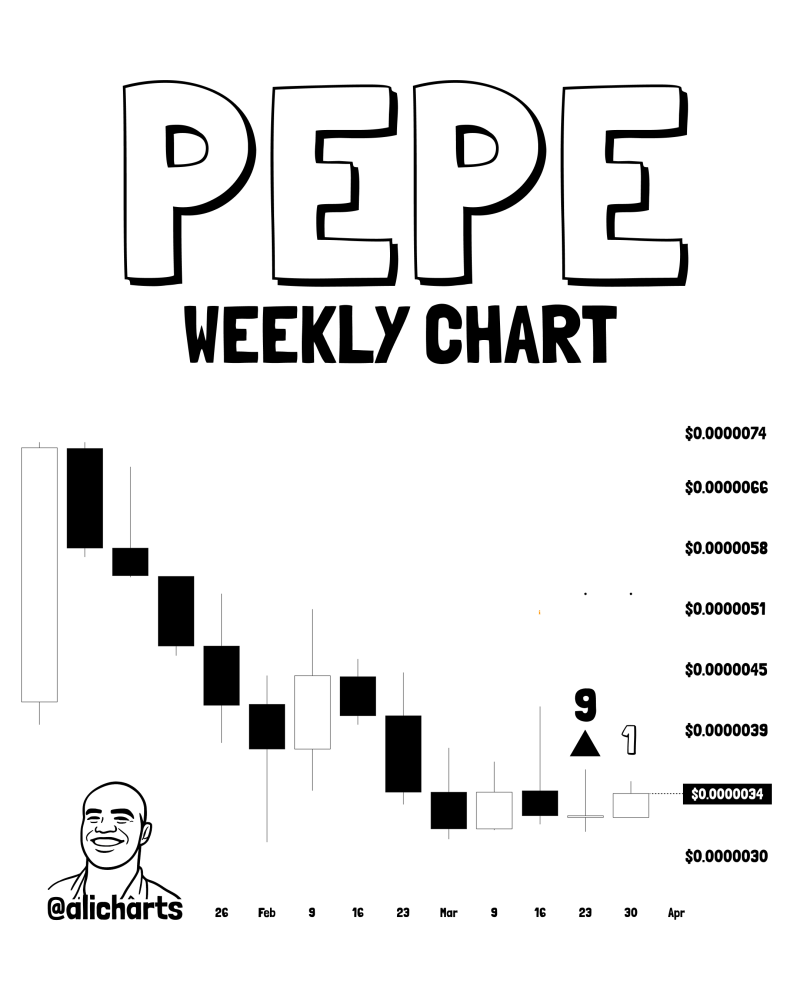
Price gradually declined toward the $0.0000030 - $0.0000034 zone, where recent candles began to compress. This shift from large bearish candles to smaller-bodied ones suggests a slowdown in momentum rather than continued aggressive selling.
Selling pressure could be exhausted after this extended move lower, with price now compressing near local lows in a way that often precedes a directional shift.
For context on how PEPE has behaved at key levels before, PEPE previously surged 40% from a demand zone on similarly elevated volume - a pattern that traders are now watching for again.
A TD Sequential Buy Signal Emerges on the PEPE Weekly Chart
A TD Sequential buy signal has now appeared on the weekly chart. This indicator typically highlights trend exhaustion after extended downside movement - not a guaranteed reversal, but a meaningful flag that the current leg may be running out of steam.
The TD Sequential signal appears right where the structure needs it most - at the point where each successive push lower is losing follow-through and candles are starting to compress.
The signal coincides with price holding just above the $0.0000030 area, where multiple candles show hesitation rather than continuation lower. This type of behavior often marks a transition phase, where sellers lose dominance and price begins to stabilize before any meaningful move in either direction.
The First PEPE Price Target Traders Are Watching
The chart points to a potential rebound toward the $0.0000050 region, which aligns with a prior price area before the most recent leg down. That level is not arbitrary - it represents a zone where price previously found both support and resistance, making it a natural magnet for any recovery move. A similar breakout dynamic was analyzed in depth when PEPE broke above key resistance in an earlier cycle.
If price begins to move higher from current levels, the key intermediate range to reclaim sits between $0.0000039 and $0.0000045. Getting through that zone would meaningfully increase the probability of testing the projected rebound target near $0.0000050. Here is what that path would require:
- Stabilization and a close above the $0.0000034 area on the weekly timeframe
- A reclaim of the $0.0000039 - $0.0000045 intermediate resistance range
- Sustained volume supporting the move rather than a low-conviction drift higher
The $0.0000039 to $0.0000045 range is the first real test - clearing it shifts the conversation from stabilization to a genuine recovery attempt.
The broader battle playing out at these levels is well-documented - PEPE bulls have fought back at critical resistance before, and how price handles the zones on the way up will matter just as much as the signal itself.
A Pause Rather Than a PEPE Reversal - For Now
While the TD Sequential signal points to a possible bounce, the broader structure still reflects a downtrend. The current setup suggests a shift from strong bearish momentum into consolidation near local lows - not a confirmed trend change.
This type of setup often leads to a relief move rather than an immediate reversal, with price reacting toward nearby resistance before the next directional decision plays out. Whether PEPE builds on a bounce or rolls over again at resistance will ultimately depend on how the market absorbs the next few weekly closes.
 Victoria Bazir


