 Marina Lyubimova

⬤ Ethereum has now closed in the red for six months in a row, a rare and notable event in its price history. This streak ranks as ETH's second-worst rolling run of monthly losses since the 2018 crypto downturn. The only longer stretch on record was a seven-month slide that followed the 2017 peak, when prices corrected sharply across the board. The current run falls just one month short of that, which puts the scale of today's weakness into sharp perspective.
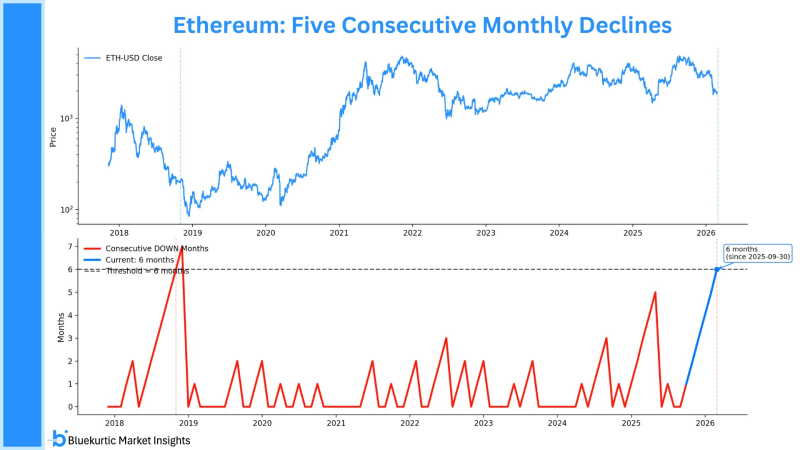
⬤ Charts tracking consecutive down months show ETH trading below major intermediate support zones, with broader market risk sentiment staying flat. The $130M in outflows and a notable drop in whale orders have added to the selling pressure, reinforcing the pattern visible across multiple timeframes. This is not just a short-term blip; the data tells a story of sustained structural weakness.
The current six-month negative run has brought renewed focus on the depth of the correction.
⬤ Extended monthly losing streaks in Ethereum tend to mirror broader weakness across digital assets. Bitcoin has also been sliding in recent months, and historical patterns suggest that significant downturns can drag on before any stabilization takes hold, especially when macroeconomic headwinds are in play. Ethereum fighting to hold $1,975 while a descending channel caps the upside is a clear sign of how technical structure has deteriorated alongside the macro backdrop.
⬤ A six-month losing streak of this magnitude shapes how market participants think about near-term price mechanics. Multi-month performance trends are increasingly being referenced alongside support and resistance benchmarks to contextualize sentiment shifts. Earlier analysis of ETH testing $3,000 with eyes on a $3,800 recovery now highlights just how far conditions have shifted. This data feeds into broader conversations around staking activity, liquidity flows, and the overall narrative direction of the crypto market.
 Marina Lyubimova


