 Usman Salis

⬤ ETH is hovering right around $1,975 on the 4-hour chart, stuck in a classic wait-and-see mode. The most visible structure is a downward-sloping parallel channel, with swing highs consistently rejected at the upper trendline and dips cushioned by the lower boundary. A broadening wedge setup had been in focus at higher levels, but the immediate picture is now defined by this tighter channel compression near $1,975.
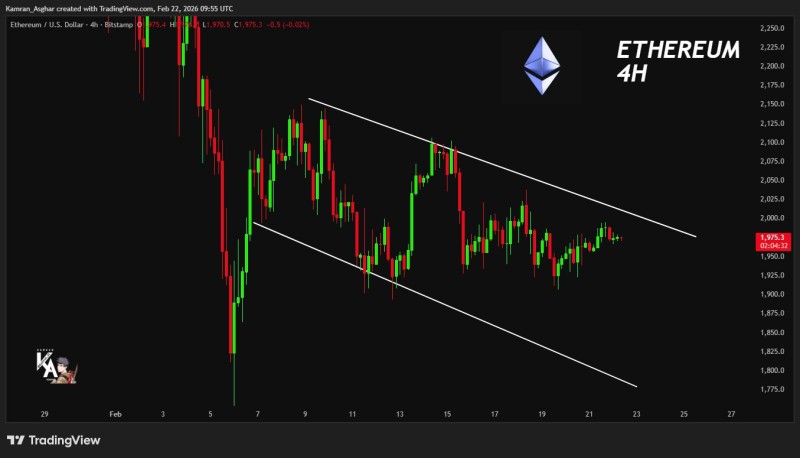
⬤ ETH staged a bounce after the February drop, but the recovery stalled quickly. Price keeps printing lower highs under the channel's top line, and the right-side label sitting near 1,975 confirms this as the current pivot. The pattern mirrors what happened when ETH hovered near $2,000 after a multi-month support breakdown, and bulls still haven't managed to flip that area into reliable support.
⬤ From a structure standpoint, Ethereum stays range-bound until the upper channel resistance cracks. The $2,000 area on the right axis is acting as a ceiling, and every push into it has faded. The situation is consistent with the broader setup where Ethereum holds below $2.1K as bulls target a breakout above resistance, but without a clean close above the trendline, the neutral consolidation thesis remains intact.
⬤ Why does this matter? Tightly compressed price action inside a defined channel tends to explode once it resolves. A breakout above the upper trendline changes the 4-hour rhythm meaningfully. A rejection keeps ETH anchored near $1,975 and the slow grind continues. Either way, the structure is clear enough that traders know exactly what level to watch.
 Usman Salis


