Peter Smith

Ethereum is at a technically important inflection point. The emerging pattern reflects weakening momentum, and as Mister Crypto noted, the chart is forming a textbook head and shoulders structure - one of the most reliable reversal signals in technical analysis.
ETH Head & Shoulders: A Textbook Formation Takes Shape
The chart clearly displays the defining elements of a head and shoulders structure: a left shoulder, a higher peak forming the head, and a lower right shoulder now developing on the right side.
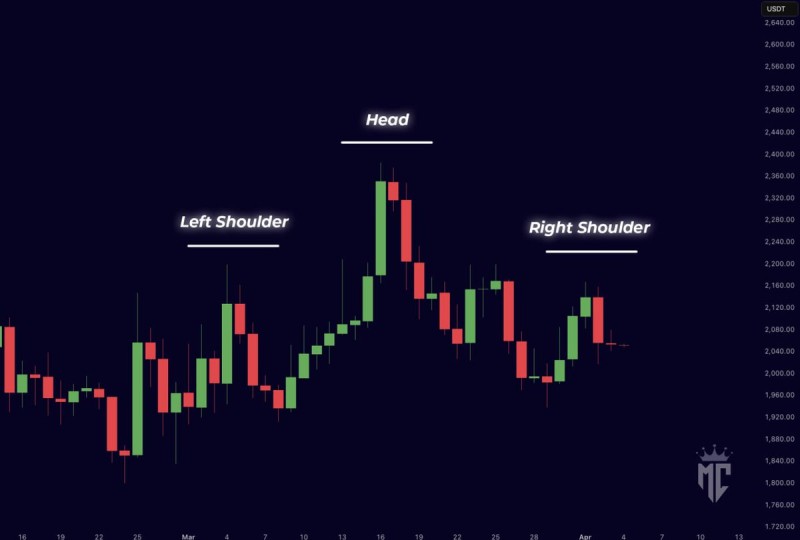
This progression signals a transition from strength to hesitation. The inability to print a higher high after the head suggests that bullish pressure is fading - and when buyers stop making progress, the balance of power starts to shift.
Price action on the right shoulder shows limited follow-through, reinforcing the idea that buyers are no longer in control of the trend.
The structure reflects a gradual change in market behavior. Each rally becomes less effective than the previous one.
From Strength to Exhaustion: What the Structure Is Telling Us
The sequence of moves within the pattern tells a clear story:
- The left shoulder forms after an initial rally
- The head represents the final push higher
- The right shoulder shows reduced buying strength
This slowdown in upward momentum is the core signal here. Each attempt to push higher is met with less conviction, and the current consolidation near the right shoulder suggests the market is no longer expanding upward - it is stabilizing near resistance.
The current consolidation near the right shoulder suggests that the market is no longer expanding upward, but instead stalling where sellers remain active.
ETH Neckline: The Breakdown Level That Matters
The neckline - the support zone beneath recent lows - becomes the key level to watch from here.
A confirmed break below this level would validate the bearish structure and signal a potential continuation lower. Until then, the pattern remains unconfirmed but increasingly relevant as repeated hesitation near current levels builds pressure on support.
A confirmed neckline break is what separates a developing pattern from an actionable bearish signal.
Similar dynamics have played out across other markets recently. Gold rejected at descending resistance showed how repeated failure near key levels can reinforce bearish setups, and Gold breaks below $4,450 as selling pressure builds demonstrated how quickly structure can resolve once support gives way.
ETH Bearish Setup: A Pattern Traders Are Watching Closely
Ethereum's structure now resembles many classic reversal setups seen across markets, where trend exhaustion leads to a directional shift. Recent crypto market behavior shows similar phases of weakening momentum after failed continuation attempts - often resulting in downside moves once support levels give way.
Rejection near resistance zones tends to reinforce bearish setups when follow-through is absent.
For now, ETH remains in a fragile position. The structure suggests downside risk, but confirmation depends entirely on whether support ultimately gives way at the neckline.
 Peter Smith