 Peter Smith

⬤ Dogecoin is developing a clear falling wedge pattern on the daily chart, with two converging trendlines creating a compressed trading zone. The setup shows dynamic resistance overhead and gradually rising support below, guiding DOGE's recent price action as volatility decreases toward the wedge's apex.
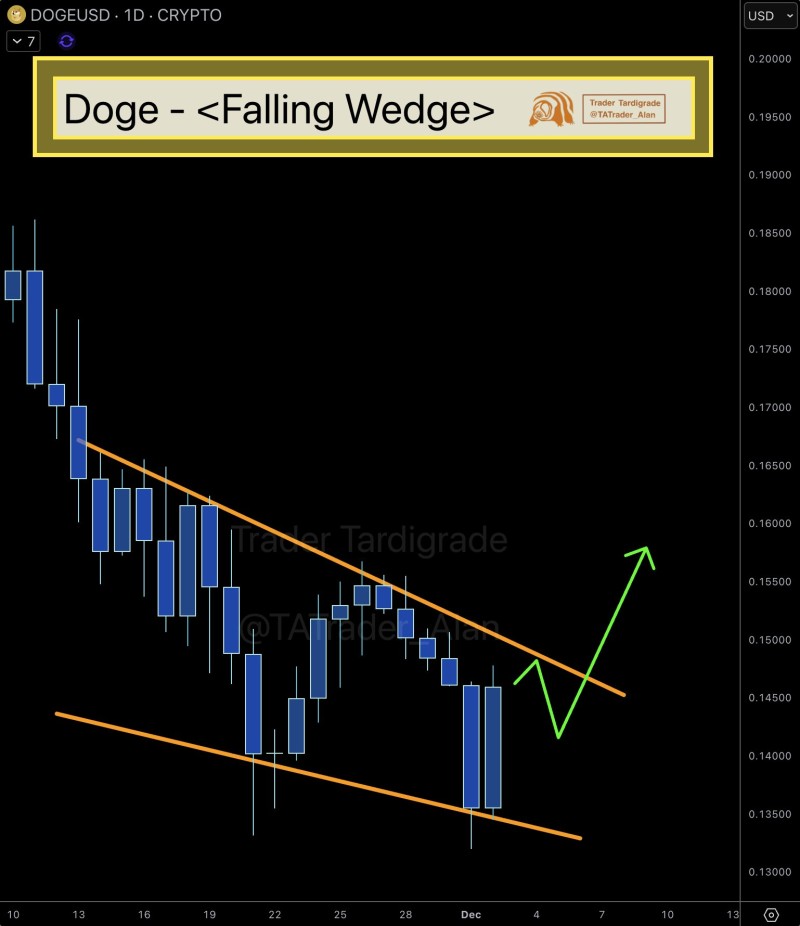
⬤ The pattern captures a phase where lower highs meet climbing support levels. Each rally has been capped by the upper trendline, while dips find buyers near the lower boundary. DOGE now sits close to the point where these converging lines could force a directional breakout.
⬤ The compression is becoming more pronounced as DOGE bounces between tightening boundaries. A sustained break above the resistance line would flip momentum and potentially unlock the upside targets shown in the chart projection. Without that breakout, the wedge could extend further as the market builds energy for its next move.
⬤ This matters because falling wedges typically resolve with bullish breakouts once selling pressure fades. If DOGE clears resistance, it could signal shifting sentiment and pull in fresh buyers. If the breakout stalls, expect more consolidation before the next clear direction emerges.
 Peter Smith


