 Saad Ullah

⬤ Dogecoin hit a critical technical zone on the 4-hour chart as DOGE pressed against the upper boundary of its descending channel near $0.151. The move sparked speculation about whether recent weakness was simply traders positioning for better entries ahead of a potential rally. The chart shows DOGE testing a trendline that's capped gains throughout November.
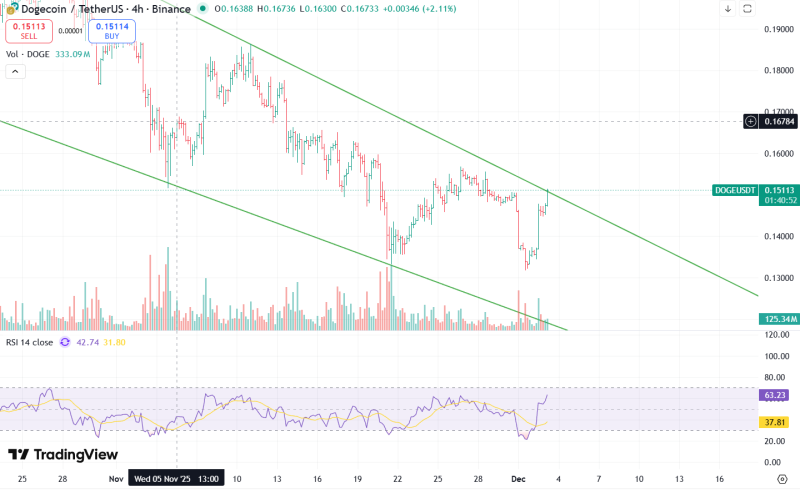
⬤ The recent bounce looks meaningful after climbing sharply from last week's lows and building a short-term recovery pattern. Trading volume picked up compared to earlier sessions, pointing to stronger market participation. The RSI climbed above 63—one of its highest readings in weeks—suggesting renewed bullish pressure. Still, the broader channel structure holds until there's a confirmed breakout.
⬤ Trader attention around Dogecoin increased as the market watches whether this resistance test becomes a larger breakout. The technical setup shows DOGE entering a decisive phase, with $0.167 marking the next major upside target if resistance breaks. Market sentiment has shifted more active as participants weigh the possibility of a structural change.
⬤ This test matters because DOGE is challenging a trendline that's repeatedly shaped price direction over recent weeks. A confirmed close above the descending boundary would signal structural improvement and could lift sentiment across speculative crypto assets. If resistance holds, price action may stay range-bound, reflecting the consolidation trend seen across the broader market.
 Saad Ullah


