 Saad Ullah
⬤ Dogecoin's still locked inside a wide multi-month consolidation structure, with price sitting near the lower region of a long-term symmetrical triangle. The latest chart shows the market tracking DOGE's position inside this compression zone. On the 12-hour chart, DOGE trades around $0.154, holding near where two major trendlines intersect.
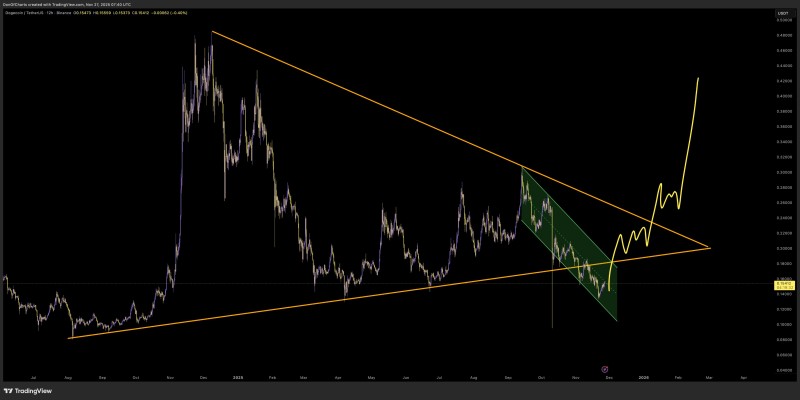
⬤ There's a large descending resistance line extending from prior highs and a rising support line that's guided the broader uptrend since mid-2024. Within this structure, Dogecoin recently moved through a descending channel that reflects the latest pullback phase. Price tested the bottom of that channel and is now trying to stabilize, lining up with a potential retest of the triangle's central area.
⬤ The projection shows how DOGE might fluctuate inside this narrowing pattern before reaching the triangle's apex. If momentum picks up, the first upside target sits above $0.22. These levels are part of the structural roadmap, showing how the long-term triangle continues shaping market expectations as DOGE trades within its boundaries.
⬤ Extended consolidation patterns like this often come before stronger directional moves once price breaks out of the structure. Dogecoin's continued interaction with both the descending resistance and rising support gives a clearer picture of where momentum could expand next. A breakout from the triangle would likely influence broader sentiment across high-volatility crypto assets—especially given DOGE's history of sharp moves following prolonged compression.
 Saad Ullah


