 Saad Ullah

⬤ Dogecoin has slipped beneath two key long-term technical levels on the DOGE/BTC chart, showing continued weakness against Bitcoin. DOGE is now trading below the 0.618 Fibonacci retracement and under its two-year moving average—a combination some analysts see as a "pretty good deal." The chart shows DOGE hovering around 0.00000173 BTC, with both indicators now above the current price.
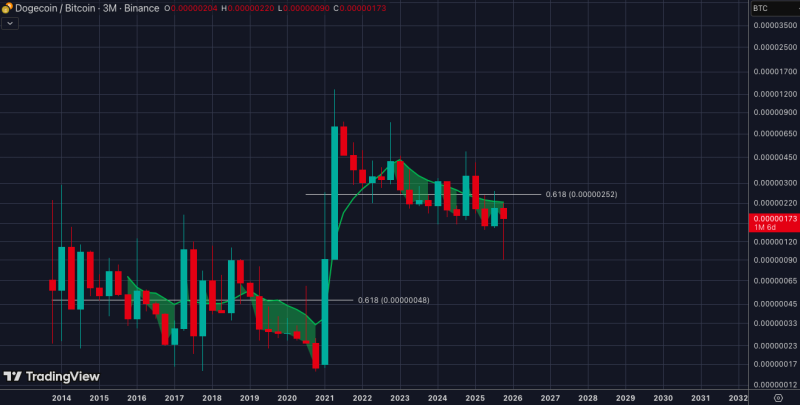
⬤ The three-month timeframe chart reveals Dogecoin's multi-cycle pattern, featuring a sharp 2021 peak followed by a prolonged retracement through 2023 and 2024. The 0.618 retracement sits near 0.00000252 BTC, a level DOGE recently broke below. A deeper historical 0.618 level from an earlier cycle around 0.00000048 BTC provides additional context. The two-year moving average has crossed above the price, confirming DOGE is below long-term trend support.
⬤ Recent trading shows ongoing consolidation beneath resistance, with several multi-month candles closing below the 0.618 threshold. DOGE has stayed under the two-year moving average for multiple quarters, reinforcing the extended downtrend relative to Bitcoin. The characterization of this zone as a potential opportunity reflects the view that such prolonged drawdowns often align with historically lower valuation areas.
⬤ This technical setup matters because DOGE's position below both the 0.618 retracement and two-year moving average puts it in a long-term zone typically associated with extended consolidation. How Dogecoin performs in this region could shape broader sentiment around its multi-cycle trend as the market moves through the current cycle.
 Saad Ullah


