Usman Salis

Dogecoin is back at one of the most closely watched levels in its entire price history. The DOGE monthly chart shows the asset touching a long-term ascending support trendline for the third time, a structural setup that has preceded two major bull runs in the past.
3 Touches, 2 Rallies: What the Monthly Chart Shows
The trendline in question connects several key lows across Dogecoin's history. The first touch triggered an explosive rally that launched DOGE into a powerful uptrend. The second interaction with the same level produced another massive move to the upside.
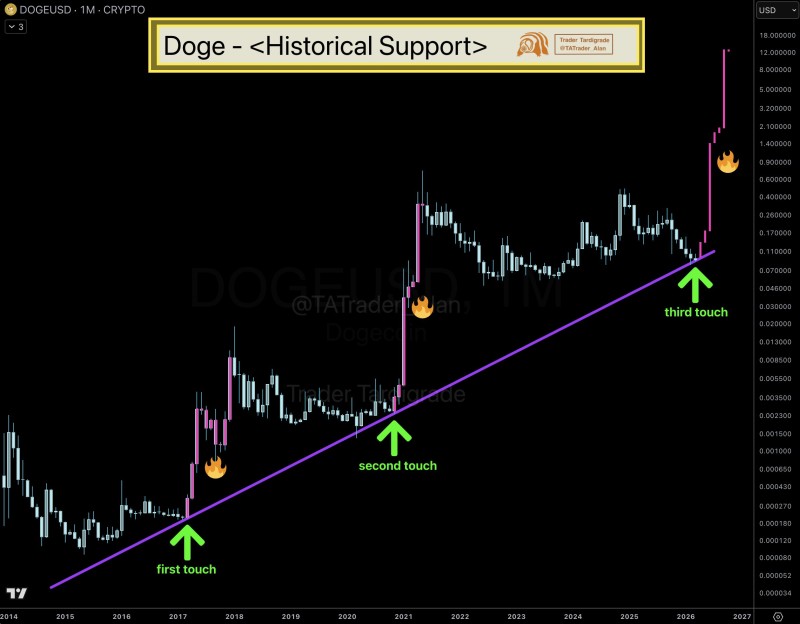
Now the third test is underway, and analysts are watching closely to see whether the structure holds again. Dogecoin Holds Above Key Uptrend as Buyers Return previously highlighted how repeated rebounds from this ascending line have defined DOGE's broader market cycles.
Consolidation Near Support: A Pattern That Has Preceded Big Moves
Beyond the trendline test itself, Dogecoin is consolidating just above the support level. Historically, extended periods of sideways action near structural lows have preceded sharp accelerations. This cyclical behavior, where accumulation near key support is followed by rapid bullish momentum, is a recurring feature of DOGE price action. Dogecoin Chart Points to a Potential Bull Run, Analyst Suggests covered similar dynamics, pointing to how historical structures have set the stage for large rally cycles.
The third test of this decade-long support places Dogecoin at a technically significant juncture. The repeated defense of this level underscores its importance within the long-term framework. Whether it holds or breaks will likely shape the next major directional move. DOGE Price Holds $0.08 Support as Dogecoin Tests Downtrend Break outlined how major support zones can define the direction of the next market phase, a dynamic that remains fully relevant at this moment.
 Usman Salis