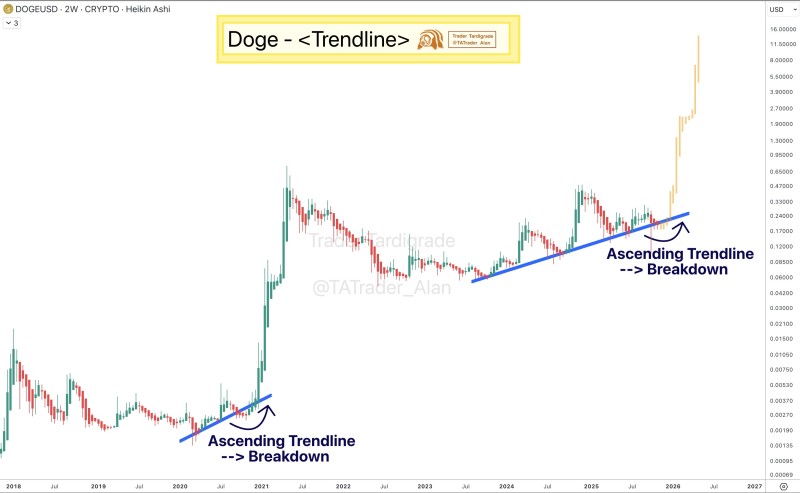
A technical analysis gaining attention in the crypto community has spotted a recurring pattern in Dogecoin (DOGE) chart. This formation—an ascending trendline breakdown followed by a dramatic surge—appeared before the explosive 2021 rally and seems to be developing again.
Dogecoin's Historical Trendline Pattern
Trader Tardigrade recently shared a chart analyzing Dogecoin's price from 2018 through 2026 on a two-week Heikin Ashi timeframe. Between 2019 and 2021, Dogecoin tracked along an ascending trendline before a brief breakdown that unexpectedly triggered the rally pushing DOGE above $0.70.

Now the same pattern is emerging. The chart shows DOGE at the edge of a multi-year ascending trendline, mirroring its pre-2021 behavior. The analyst suggests a similar breakdown could launch another rally rather than signal bearish reversal.
Technical Overview and Key Observations
An ascending support line has guided Dogecoin's movement since mid-2022. While breaking below typically signals bearish sentiment, Dogecoin historically defies standard patterns. The chart projects a potential exponential move if the cycle repeats. Momentum is compressing near support, often preceding strong volatility. Long-term holders watch for volume spikes or recovery above $0.20. This could mark a "mirror cycle"—a technical echo of 2021's surge.
Market Context and Supporting Factors
Dogecoin typically leads speculative phases during bull runs due to its strong community. Current conditions favor momentum shifts: Bitcoin consolidating near yearly highs, growing interest in meme-based assets, and DOGE's sustained visibility as both a payment token and cultural symbol. These factors may align to amplify a technically driven rally if support holds.
Price Levels Worth Watching
- $0.15–$0.20: Current support zone near the ascending trendline
- $0.35: Mid-cycle resistance from 2024
- $0.70: Former all-time high from 2021
- $1.00+: Psychological milestone confirming new uptrend
Dogecoin's technical setup suggests it may be entering another bullish cycle. If patterns repeat, the trendline breakdown might signal the start of another explosive rally. While past performance doesn't guarantee future results, the similarities to 2021 are notable enough to keep traders watching.
 Victoria Bazir

 Victoria Bazir


