Peter Smith

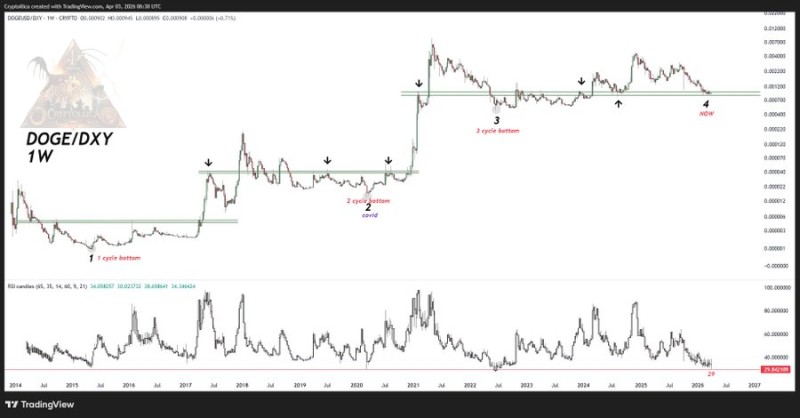
Dogecoin is flashing one of its most significant technical setups in years. The weekly RSI has compressed to 29 - a reading that has historically appeared near major inflection points rather than the start of sustained breakdowns. Crypto analyst Hailey LUNC XRP flagged the setup, pointing out that current price positioning on the DOGE/DXY chart aligns closely with where previous cycle lows formed.
The combination of structural support and deeply oversold momentum is drawing renewed attention from technical traders. Both signals are appearing simultaneously, and that overlap is what makes the current setup stand out.
Dogecoin Chart Shows a Repeating Cycle Structure
The weekly chart reveals a pattern that has played out across multiple years. DOGE forms a cycle bottom near a consistent horizontal support zone, stabilizes, then transitions into an expansion phase. The current price action sits at what the chart labels as a new cycle point - positioned in the same structural area where prior bottoms developed.
This repetition is not coincidental to long-term DOGE observers. Each prior cycle followed a similar sequence: price compresses at support, momentum resets to oversold, and a directional move eventually follows. The current phase mirrors that sequence closely.
The alignment of current price positioning with previous cycle lows is drawing significant attention from long-term chart watchers.
DOGE RSI at 29 - Levels That Historically Mark Accumulation Zones
The most prominent signal on the chart is the weekly RSI reading of 29. That places Dogecoin firmly in oversold territory - a condition that, historically, has not marked the beginning of sustained selling pressure but rather a transition into accumulation. Past analysis shows that similar RSI levels coincided with periods of extreme downside momentum followed by stabilization.
The RSI structure itself tells a cyclical story. Deep compressions like the current one have repeatedly preceded directional moves. The pattern of expansion and reset appears consistent across prior cycles, with each oversold extreme eventually giving way to a recovery phase.
When the weekly RSI reaches levels this low, it typically reflects exhausted selling pressure rather than accelerating downside.
Price Holds a Key Historical Support Zone
Beyond the RSI signal, DOGE is currently sitting at a horizontal level that has served as a structural base across previous cycles. The chart marks this area as a recurring support zone where price has paused before transitioning into new phases. Dogecoin's RSI strength has previously signaled potential upswings from similar structural positions.
The consistency of reactions at this level reinforces its technical weight. Each prior cycle bottom formed in proximity to this zone, making the current test significant for traders watching long-term structure.
Momentum Compression Signals a Decision Point for DOGE
With price at long-term support and RSI pinned in oversold territory, Dogecoin is entering a compressed state that historically has not persisted without a directional resolution. Technical observations confirm that when RSI rebounds from oversold levels, it can signal weakening selling pressure and a potential shift in momentum.
A compressed RSI at structural support has historically been the setup that precedes the most significant moves in Dogecoin's cycle history.
The current setup includes the following key conditions:
- Weekly RSI at 29 - matching levels seen near prior cycle lows
- Price holding at a horizontal support zone consistent across multiple cycles
- RSI structure showing the same compression pattern seen before previous directional moves
- DOGE/DXY alignment matching historical cycle bottom positioning
Whether this phase resolves into stabilization or continuation lower will depend on how price reacts at this level in the coming weeks. The chart structure is familiar - but confirmation still requires price action to follow through.
 Peter Smith