 Usman Salis

After a sharp decline, Dogecoin (DOGE) is beginning to show technical signs that the worst of the sell-off may be behind it. A clear bullish divergence has appeared on the Relative Strength Index (RSI), hinting that selling pressure is weakening. With support holding near recent lows, traders are now watching for the possibility of a short-term rebound.
Technical Analysis Reveals Bullish Signal
The 4-hour Dogecoin chart shows price action making lower lows while the RSI indicator prints higher lows, as noted by Trader Tardigrade. This pattern, called a bullish divergence, often precedes a reversal in trend.
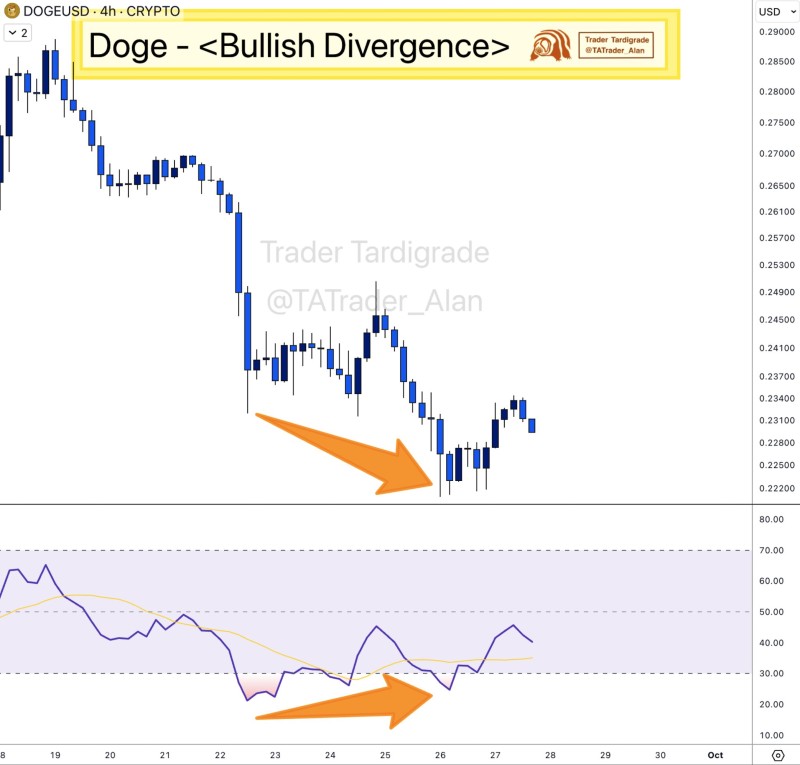
Key insights from the chart: DOGE has stabilized around $0.222–0.225, forming a potential floor. Momentum is shifting upward as RSI rises from oversold territory. Upside targets are clustered at $0.237 and $0.245, which could test bullish strength. A clean break above $0.245 may encourage momentum traders to step back in.
Market Implications
Bullish RSI divergences are closely watched by traders because they often highlight exhaustion in a downtrend. For Dogecoin, this comes at a time when crypto markets are stabilizing after recent corrections. DOGE remains highly sensitive to shifts in retail sentiment, and broader risk markets are showing improving appetite for speculative assets.
Price Targets and Next Steps
If the bullish divergence plays out, Dogecoin could see a near-term rally toward the $0.245–0.250 resistance zone. A breakout above this level would confirm improving momentum and open the door to further gains. However, failure to hold support at $0.222 could expose DOGE to deeper downside.
 Usman Salis


