 Usman Salis

⬤ Cardano's monthly chart is telling a familiar story. ADA is currently pressing against the lower boundary around $0.28, right where price tightened up before the last major rally. According to Bitcoinsensus, this isn't random noise — it's the same kind of compression the market saw before the previous explosive move kicked off.
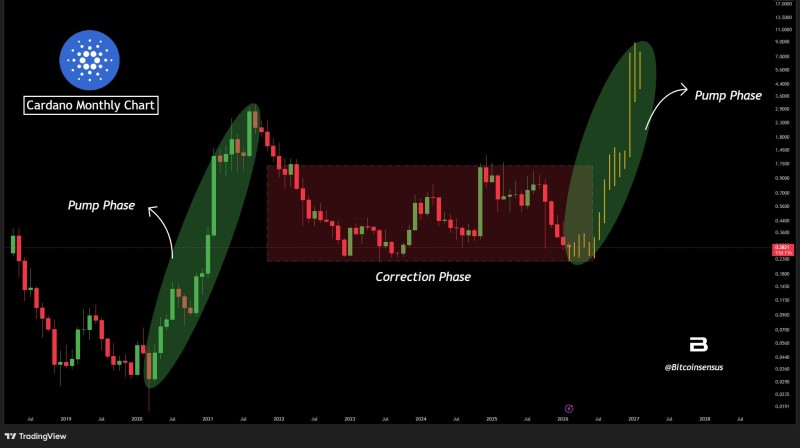
⬤ The chart maps out three repeating stages: a sharp pump, then a multi-year correction grind, then another expansion. Right now ADA sits near the lows of that correction range — not breaking down, just coiling. That's the same spot that historically preceded a breakout, and it fits the pattern of historical Cardano cycle structure behavior visible on higher timeframes.
The current structure places ADA again near range lows, where price movement is tightening rather than trending downward.
⬤ If the cycle repeats, the chart projects a potential move into the $3 to $9 zone. That's the expansion target based purely on structural comparison — not a guarantee, but a historically grounded range. It maps directly onto the ADA long-term trend formation that's been building for years.
⬤ Crypto cycles have a way of rhyming. If ADA continues to mirror past behavior, this compression phase could be the calm before the next directional push — a pattern that would define the Cardano market outlook going into the next cycle.
 Usman Salis


