 Usman Salis

Bitcoin is sitting in a critical squeeze zone, with the chart showing current price at $67,314 and large liquidation clusters forming on both sides. According to Nehal, more than $6 billion in short liquidations are stacked above toward $72,500, while about $2 billion in long liquidity sits below near $65,000. That leaves BTC caught in a narrow band where a break higher could trigger a short squeeze, while a drop could force long liquidations.
Where Bitcoin's Liquidation Pressure Is Building
The liquidation map places Bitcoin near the middle of the current range, with the upside cluster clearly heavier than the downside. The green cumulative short liquidation curve rises sharply as price moves toward the low-$70,000 area, while the red cumulative long liquidation curve is concentrated below the market and fades as price approaches the current zone.
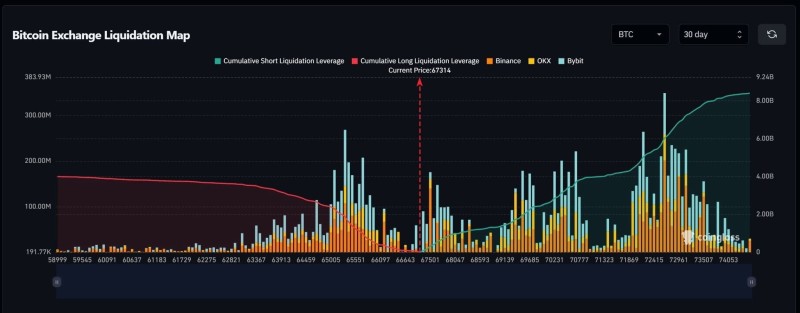
That imbalance matters because it shows where leverage is most exposed. The chart focuses entirely on liquidation structure and positioning, with no trend indicators like moving averages in the picture. What it does show clearly is a market pinned between two visible pools of risk. BTC Holds 66,200 Support as Breakout Setup Tightens offers additional context on how this support level has been holding up under pressure.
The BTC Move That Could Unleash $6B in Short Liquidations
If BTC pushes into the $72,500 zone, the larger stack of short liquidations could begin to unwind quickly, adding fuel to an upward move. A look at BTC Holds $65K-$72K Range as $72K Liquidity Zone Draws Attention shows how this upper boundary has been acting as a magnet for price action in recent sessions.
When both sides of the liquidation map are loaded like this, it is not a question of whether volatility comes - it is a question of direction.
If price breaks lower toward $65,000, the long side becomes vulnerable to a flush. Either scenario sets up a fast, potentially aggressive move once the compression breaks.
Bitcoin Coiled Between $65K and $72.5K With No Clear Breakout Yet
For now, Bitcoin is not breaking out. It is compressing between two liquidation targets, and the structure supports the core thesis here: the market is coiled, and the next decisive move could be sharp. BTC Eyes Breakout as $70K Becomes Pivot breaks down why the $70K level in particular is becoming a key decision point for traders watching this setup.
The current range between $65,000 and $72,500 is not just technical resistance and support - it is a loaded liquidation corridor, and whichever side breaks first will likely do so with force.
 Usman Salis


