 Marina Lyubimova

After a period of elevated volatility, Bitcoin has settled into a well-defined intraday band. Repeated reactions at both support and resistance suggest the market is loading up for its next directional move - and traders are paying close attention. Crypto Tony noted that the expected session may stay slow, with reduced volatility keeping price contained inside the current structure.
BTC Range Structure: 66,200 Support vs. 68,000 Resistance
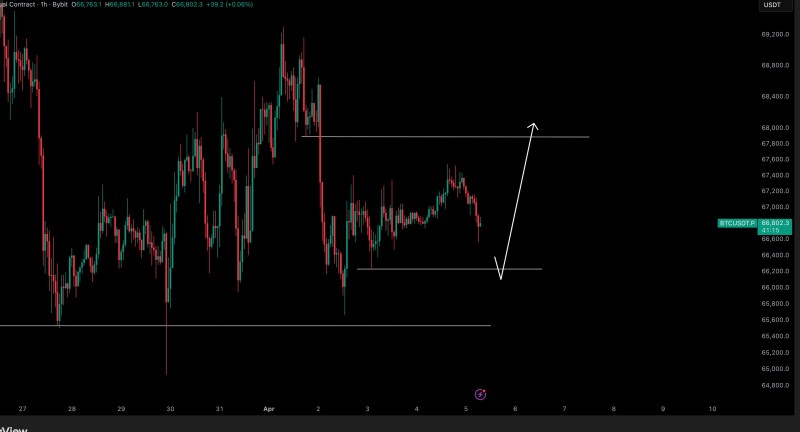
The chart shows Bitcoin moving sideways between roughly 66,200 on the support side and 67,800-68,000 on the resistance side. Price has tested both boundaries multiple times without a breakout, forming a clean horizontal consolidation range.
This behavior reflects a balance between buyers and sellers, with neither side gaining control. The repeated rejections at the top and defenses at the bottom reinforce these levels as the key short-term boundaries to watch. This type of consolidation is consistent with broader market behavior - Bitcoin often builds liquidity inside tight ranges before expanding, as seen in Bitcoin Stuck in $60K-$71K Range: Will BTC Break Out Soon?, where similar range-bound conditions preceded directional moves.
The Failed Push That Led to BTC Compression
Before entering this range, BTC experienced a sharp rejection from higher levels, which reset short-term momentum. Since then, price action has shifted into smaller, overlapping candles - typical of compression phases where volatility contracts before the next expansion.
Attempts to move higher have consistently stalled near resistance, while downside moves have been absorbed near support. This creates a tightening structure where pressure builds on both sides. A comparable setup was recently observed in Bitcoin Rejects $68K Range High - What's Next for BTC?, where rejection at range highs led to continued consolidation within defined boundaries.
BTC Liquidity Sweep: The Setup Traders Are Watching
The chart outlines a potential scenario where price briefly dips below support before reversing higher - a pattern often associated with liquidity sweeps, where the market clears stop orders below a level before pushing in the opposite direction.
The key technical elements visible on the chart include:
- Strong support near 66,200 holding multiple tests
- Resistance near 67,800-68,000 capping upside
- A potential downside sweep before a move higher
Such setups often resolve once liquidity builds on both sides of the range. Similar dynamics - where BTC compresses before expansion - have been highlighted in Bitcoin Range Builds Below $71K-$72K VaH Resistance, where tightening price action preceded a breakout attempt.
Once price moves beyond either boundary, the next leg could develop quickly - the compression building inside the range is the fuel.
For now, Bitcoin remains locked inside its range. But the structure suggests that once price moves beyond either boundary, the next leg could develop quickly. The compression building inside the range is the fuel - the breakout will be the spark.
 Marina Lyubimova


