Saad Ullah

Bitcoin's recent price action has played out almost exactly as outlined in prior analysis - a gap fill triggered a reaction, and the pullback that followed has reinforced the broader structure across multiple timeframes. The setup continues to offer a clean example of how market mechanics repeat across different trading horizons.
According to Astronomer, the expected pullback materialized right after the gap was filled, confirming how price keeps respecting the outlined system across both intraday and higher timeframes.
The 66K Gap Fill That Triggered the BTC Reaction
On the 2-hour timeframe, BTC moved lower into the highlighted gap zone near the mid-66K region, completing the anticipated fill.
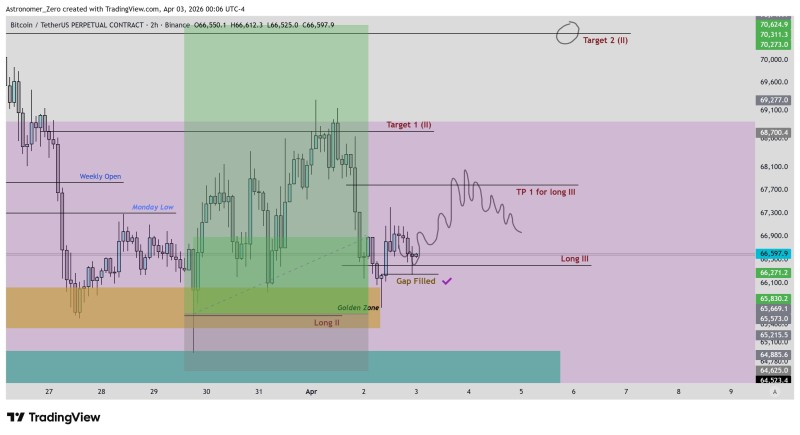
This level had been clearly marked on the chart ahead of time, and price reacted almost immediately after reaching it.
The move aligns with the expectation that price would first retrace to fill the imbalance before establishing the next directional move.
The execution was clean - no overextension, no messy wick chase. Just a straightforward fill followed by a reaction, which is exactly the kind of behavior that gives this setup its validity.
Short-Term Bias After the Pullback
Following the gap fill, the 2-hour structure shifted to a short-term bearish bias, as described in the original analysis. Price is now consolidating between 66.2K and 66.6K - a zone labeled as a long area on the chart, where local reactions are forming.
That said, nothing has confirmed a strong directional breakout just yet. The market is sitting in a base, not launching from one.
Price is consolidating near the 66.2K - 66.6K region, representing a local base where reactions are forming, but not yet confirming a strong directional breakout.
Lower timeframes are reflecting the same structure. The bias inherited from the 2-hour chart is visible across smaller intervals as well, with internal pullbacks and liquidity reads shaping the granular price action in the same way.
Bitcoin Eyes the 67.7K Target After BTC Gap Fill Completes
Zooming out slightly, the next area of interest sits near 67.7K. This is the higher-timeframe target that comes into focus now that the lower-timeframe gap fill has been completed.
The projected path points to a gradual move upward - not an immediate breakout. The market is still working through internal structure and liquidity, and the price action reflects that. A slow grind rather than a sharp spike is the more likely scenario given current conditions.
A System Playing Out Across Timeframes
What makes the current BTC setup particularly notable is how consistent the structure is across timeframes. The same logic applied to hourly and daily charts is showing up on lower intervals too - internal pullbacks, liquidity reads, and imbalance fills are all behaving in line with the broader framework.
The recent sequence of gap fill followed by pullback demonstrates how these mechanics unfold in real time, offering a clear example of structure being respected across different trading horizons.
The recent sequence of gap fill followed by pullback is a textbook example of this. For broader context on where Bitcoin stands within its larger range, the 71K breakout level remains the key higher-timeframe milestone to watch. And for those tracking the longer consolidation phase, BTC holding above 60K while the market stalls remains relevant structural context.
 Saad Ullah