Peter Smith

Bitcoin is attempting to stabilize after a sharp decline from recent highs, with price currently hovering near $67K. A chart from Sheldon Diedericks highlights a potential move toward the $83,000 resistance zone in April, followed by the risk of new lows forming afterward - setting up a critical inflection point for BTC's broader trend.
A Clean Break From the BTC Uptrend
The chart shows Bitcoin transitioning from a sustained uptrend into a clear corrective phase. Throughout 2023 and 2024, price followed a steady ascending trendline, forming higher highs and higher lows as momentum built toward the cycle peak above $110K.
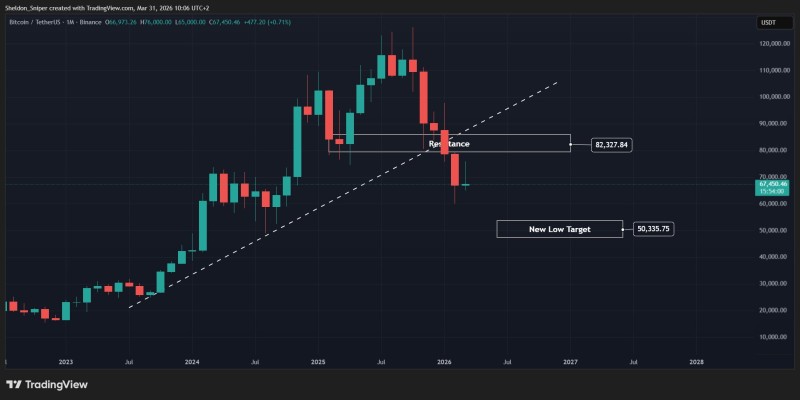
That structure has now been broken. A sequence of strong bearish monthly candles pushed BTC below the rising trendline, signaling a shift in market control. The loss of this trend support marks a structural change, with price no longer maintaining its previous pattern of continuation.
The $83K zone is the key inflection point: whether it holds as resistance or gets reclaimed will determine the next phase.
Where the Bitcoin Rebound Meets Resistance at $83K
Despite the breakdown, the chart outlines a potential short-term push higher. The projected path suggests Bitcoin could rebound from current levels and test the $82K - $83K zone. This level stands out for a few clear reasons:
- It aligns with a prior support region that has now flipped into resistance
- It sits within the path of the broken trend structure
- It represents the first major barrier to any recovery attempt
If price reaches this zone, the reaction there becomes critical. A rejection would reinforce the shift in structure, while a reclaim would be needed to challenge the current bearish momentum. Similar dynamics are explored in Bitcoin Tests 50% Retracement at $77K Below $80K Resistance, where BTC struggles to hold key levels after a pullback.
Once the ascending trendline breaks, the first bounce becomes a test - not a recovery.
The Risk of BTC Extending the Downtrend Toward $50,300
Beyond the potential bounce, the chart clearly points to a deeper downside scenario. A marked new low target sits near $50,300, indicating the correction may not yet be complete. The structure supports this possibility:
- The break of the ascending trendline removes the primary support
- Price is no longer forming higher highs
- Momentum has shifted toward sellers unless resistance is reclaimed
This creates a sequence often seen in technical analysis - breakdown, relief rally, and continuation lower. A comparable structure is outlined in BTC Breaks Bullish Structure as $65K Support Faces Critical Test, reinforcing the risk of further downside if key levels fail to hold.
Breakdown, relief rally, continuation - this sequence plays out repeatedly at major trend shifts.
The Setup BTC Traders Are Watching
The current Bitcoin structure is defined by a possible short-term recovery into resistance followed by a decisive move. For now, BTC remains in a corrective structure. The projected move higher does not yet signal a reversal - only a test of resistance.
What happens at the $83K zone will likely shape whether Bitcoin stabilizes or extends toward lower levels. Broader bearish continuation scenarios, including those discussed in BTC Rejected at $76K as Bearish Structure Points to Sub-$50K, highlight how similar setups can evolve into significantly deeper corrections.
 Peter Smith