 Usman Salis

⬤ BNB is stuck in consolidation beneath a key technical ceiling. The first resistance zone sits between $684 and $722, and until price breaks and holds above that band, there's no confirmation of a bullish reversal. Traders are watching closely for a decisive move in either direction.
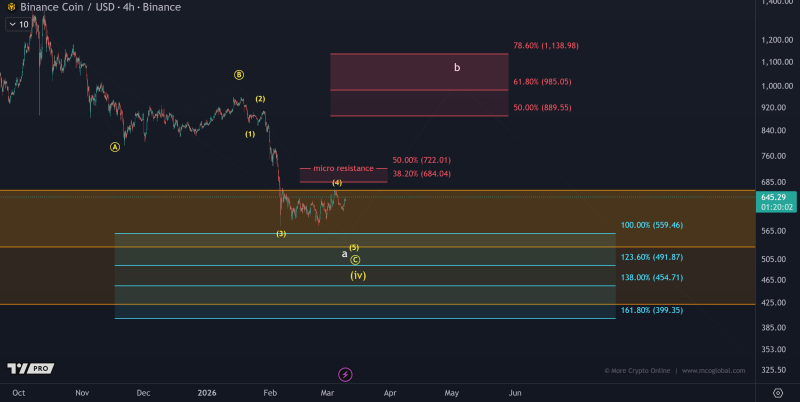
⬤ The chart shows BNB hovering around the mid-$600s after a sharp earlier decline. Several Fibonacci retracement levels cluster inside the $684-$722 zone, capping upside momentum. Reclaiming this range is the minimum requirement before any sustained rally can develop.
Until BNB breaks and holds above $684-$722, the market has not confirmed a sustained bullish breakout.
⬤ The wave structure leaves room for one more leg lower before a stronger rebound. Downside extension targets range from $559 to $491, with deeper Fibonacci levels at $454 and $399 if selling pressure continues. This aligns with the scenario outlined in Binance Coin Pattern Signals Possible Drop to $560, where analysts flagged the $560 area as a probable target within the corrective wave count.
⬤ BNB remains trapped between overhead resistance and structural support below. As explored in BNB Price: 60% Down From ATH, $570 Support in Focus, key support levels will determine whether the market stabilizes or extends its decline. Without a clean break above $722, the corrective framework stays intact.
 Usman Salis


