 Marina Lyubimova

⬤BNB is drawing close attention from technical traders as a corrective pattern develops on the BNB/USDT 4-hour chart. Binance Coin is currently trading near $640 following a volatile slide from its earlier highs. BNB Price: 60% Down From ATH, $570 Support in Focus noted that the $570 zone remains a critical level where the next major directional move could be decided.
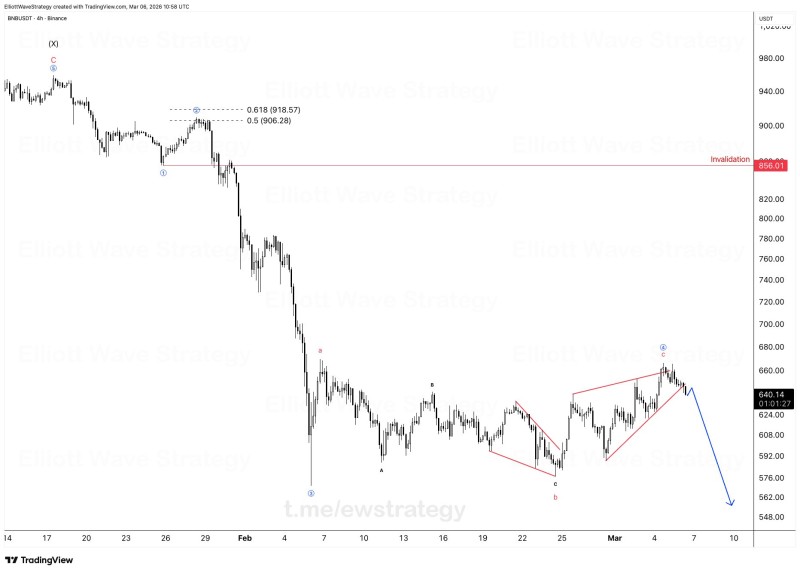
⬤The chart maps an Elliott Wave structure showing a series of corrective waves following an earlier sharp impulse lower. After the initial decline, BNB worked through consolidation phases labeled A, B, and C, reflecting a classic corrective cycle. The most recent price action is shaping a rising wedge-like formation, a pattern typically associated with fading upward momentum during corrective rallies. BNB Price Analysis: Binance Coin Stuck Below $668 Resistance explains how persistent failure to reclaim resistance can reinforce a bearish structure.
⬤If the structure resolves to the downside, the technical projection points toward the $560–$550 region. The chart marks an invalidation level near $856: a move above that threshold would cancel the bearish wave count and suggest a structural shift. Fibonacci retracement levels around $906 and $918 from the earlier wave structure show where resistance previously emerged during the correction. Binance Coin Holds $600 Support in Key Squeeze Zone describes the compression building around $600 that could precede a decisive move in either direction.
⬤The current setup is a reminder that patience matters more than speed when navigating complex patterns. Consolidation phases are common while the market decides its next move. Waiting for a confirmed breakout or breakdown from the current structure is the cleaner approach, whether BNB continues its corrective trend or shifts into a new phase within the broader crypto cycle.
 Marina Lyubimova


