 Saad Ullah

⬤ Binance Coin (BNB) just lost an important technical pattern on the two-week chart after slipping below its ascending channel. The price is now putting pressure on the $600-$610 zone following the breakdown.
⬤ The chart reveals BNB getting rejected from higher levels and dropping sharply toward what used to be the channel's lower boundary. Losing this channel changes the picture from "moving up" to "testing support." Right now, BNB is hovering around $605, and everyone's watching to see if buyers can step in and hold this demand zone. A nearly identical scenario played out recently when BNB tested critical $600 support, with this same area serving as the make-or-break point.
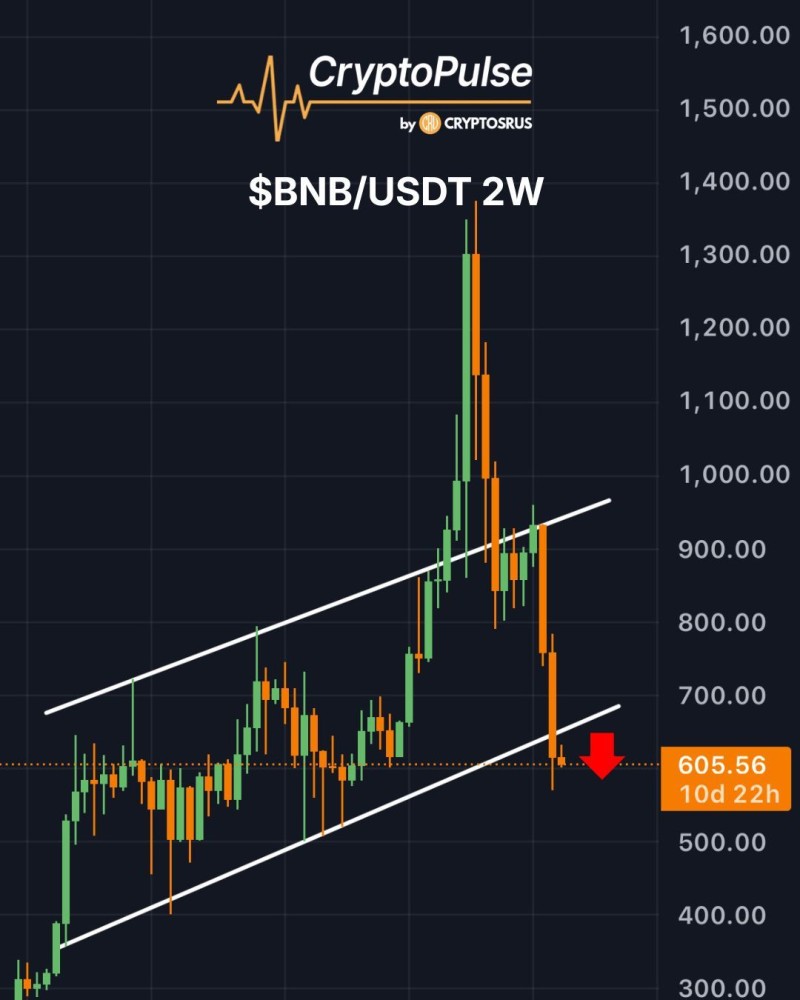
⬤ As one analyst noted: "The $600 level now becomes the key directional signal - holding it keeps consolidation intact, while losing it confirms the structural breakdown."
⬤ If $600 doesn't hold, the chart suggests the next cushion sits around $500-$520 based on the structure. On the flip side, bulls would need to push BNB back above $700 to flip momentum positive again and repair the broken channel. We saw something similar when BNB got stuck below key resistance after another channel breakdown created lower highs.
⬤ What happens at $600 will likely decide where BNB goes next. A hold here means consolidation and time to rebuild, but a clean break lower could trigger a deeper correction and confirm that the uptrend is over for now.
 Saad Ullah


