 Eseandre Mordi

Bitcoin is flashing clear warning signs. After losing key structural support at $69,000, BTC is now trading around $67,800, with the chart telling a straightforward story: what was once support is now resistance, and sellers remain in control. The question is whether the $66K demand zone can hold and stabilize the market.
$69K Falls: How Bitcoin's Structure Shifted Below Key Levels
Bitcoin broke down through both a rising trendline and the $69,000 horizontal support, leaving price trading beneath failed structure. As analyst Ardi noted, this marks a clear behavioral shift, where prior support zones now act as overhead resistance on any recovery attempt.
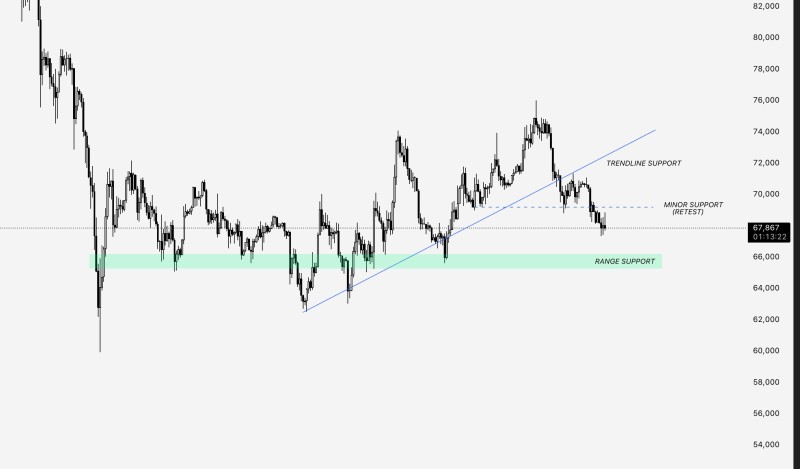
The breakdown follows a pattern well-documented in recent BTC setups. In BTC Price Analysis: Bitcoin Eyes $71,700 on $70,900 Reclaim, the $70,900 level flipped into resistance after a similar structural loss, reinforcing bearish conditions. Short-term bounces in this environment are retests, not signs of strength.
$66K Demand Zone: Bitcoin's Next Make-or-Break Support
With $69K gone, momentum is now pointing toward $66,000, the next major demand area visible on the chart. This progression mirrors analysis covered in Bitcoin Tests $70K Range: $66K Support Comes Into Focus, which flagged that losing the $69K-$70K region opens a direct path to lower liquidity zones.
The $65K-$66K range now represents Bitcoin's last meaningful defense before deeper selling pressure builds. Bitcoin Holds $69K Support With $65K Risk Below previously highlighted this level as a critical floor. How BTC reacts at $66K will likely define near-term direction for the entire crypto market.
Bitcoin's current positioning reflects a transition, not a collapse. But structure is broken, former supports are now ceilings, and price action is increasingly reliant on deeper demand to find footing. The $66K zone is the pivotal test ahead.
 Eseandre Mordi


