 Usman Salis

Oil markets are entering a more uncertain phase as recent price action starts to lose alignment with prior bullish momentum. Matthew Dixon notes that the WTI chart has continued to track technical expectations closely - with structure leading developments rather than reacting to outside triggers.
The chart has continued to follow technical expectations, with structure leading developments rather than reacting to them.
WTI Rally Hits a Wall Near $110-$115
The chart shows WTI crude pushing higher into the $110-$115 region before running into resistance and reversing sharply. What started as a steady advance quickly shifted into a volatile corrective phase.
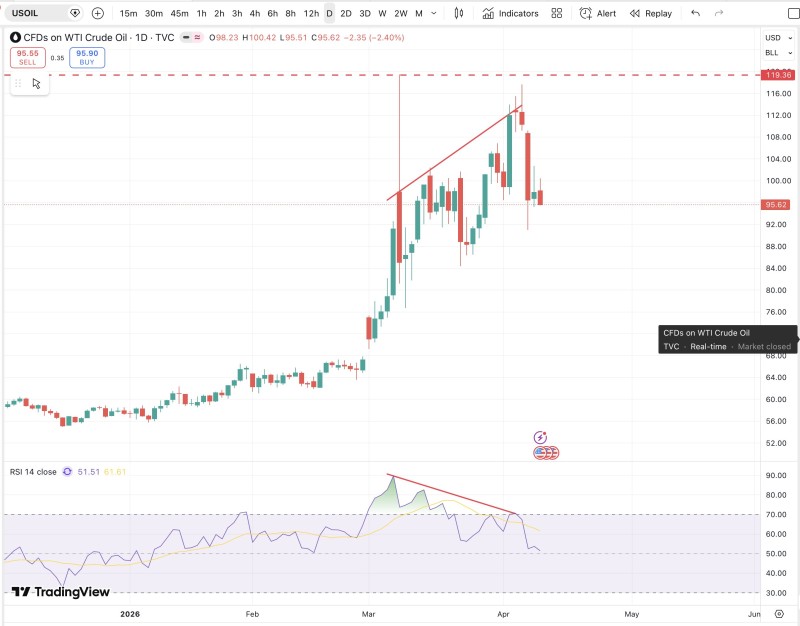
After forming higher highs, price failed to hold near the upper boundary - triggering a sequence of strong bearish candles that pointed to exhaustion, not continuation. The rejection broke the prior rhythm of the trend in a way that's hard to ignore.
Once price failed to sustain the move near the upper boundary, the prior trend rhythm was effectively broken - what followed was consistent with exhaustion, not a temporary pause.
RSI Divergence on WTI: A Classic Warning Signal
While price was still climbing toward the highs, the RSI had already begun to trend lower. A clear descending trendline formed on momentum - signaling weakness even as price attempted one more push upward.
This type of divergence is a well-established warning sign in technical analysis. When momentum fails to confirm price strength, it often means the trend is becoming unstable. Recent oil market analysis has shown how quickly sentiment can shift once momentum fades, especially around critical resistance zones.
WTI Oil Now at a Decision Point Near $90s
Following the rejection, price has pulled back toward the mid-$90 range, where it is currently stabilizing. The move reflects a transition from impulsive upside into a more neutral or corrective structure.
The RSI has continued to decline alongside price, reinforcing the idea that upward pressure has meaningfully weakened. What comes next is genuinely open - this is a balance point between a resumption of the broader trend and a deeper correction. Earlier momentum bursts in WTI have historically resolved in both directions from similar setups.
The market is now in a state where direction is no longer clearly defined - and that itself is meaningful information for traders watching this chart.
When Technical Structure Leads the Narrative
The core takeaway from this chart is consistent with where the analysis started: price structure held to expectations even as conditions evolved around it. The sequence played out in a recognizable order:
- Price followed a defined upward path before rejecting at resistance
- Momentum weakened ahead of the reversal, not after
- Current structure reflects a transition into consolidation or deeper correction
This reinforces one of the more durable ideas in technical analysis - that price behavior often shapes the narrative rather than reacting to it. The setup was visible before the move, not just in hindsight.
 Usman Salis


