Usman Salis

A powerful shift is unfolding in European gas markets. Speculative funds have rapidly moved from bearish to aggressively bullish positioning in Dutch TTF futures, reaching one of the largest net long exposures in over a year. This is no longer a market hedging risk - it's a market actively positioning for upside.
TTF Gas Positioning Reversal: From -93 TWh to 287 TWh in 3 Months
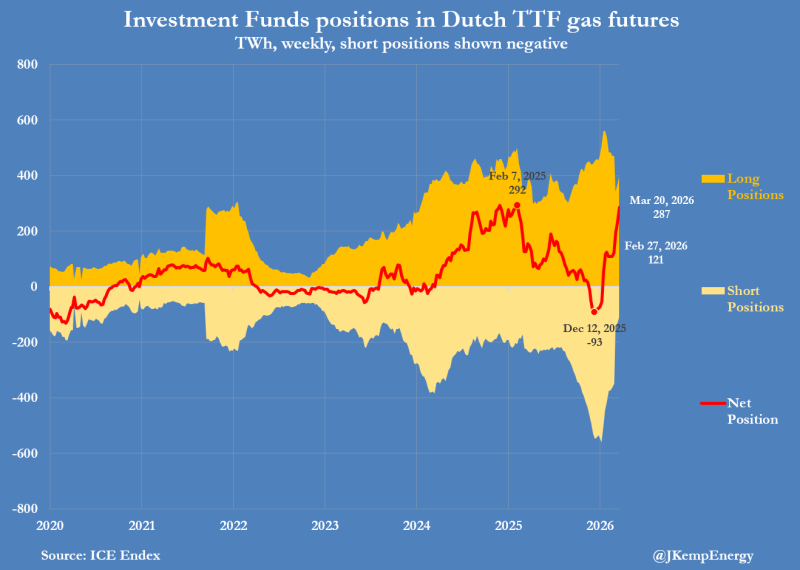
As John Kemp noted, fund managers added another 52 TWh in the latest week, bringing total purchases to 165 TWh over three months. The result: a net long position of 287 TWh - one of the highest readings in the dataset.
The net position line surged from -93 TWh in December 2025 into strongly positive territory by March 2026. This was not a gradual recovery. Positioning flipped sharply, signaling a decisive shift in sentiment.
The speed and scale of this transition suggest funds are positioning ahead of potential supply disruption rather than reacting after the fact.
Key milestones in the shift:
- Dec 12, 2025: -93 TWh (net short)
- Feb 27, 2026: 121 TWh (net long)
- Mar 20, 2026: 287 TWh (net long)
Longs Build as TTF Short Positions Get Unwound
The chart reveals a dual dynamic. Long positions expanded toward roughly 500+ TWh, while short positions collapsed sharply - at one point extending below -500 TWh before reversing hard.
This combination amplified the net positioning move. It wasn't just fresh buying - it was also forced or strategic short covering that accelerated the swing.
From a structural perspective, the move above 200 TWh represents a breakout from the typical positioning range seen throughout 2023-2025. Historically, net exposure struggled to sustain levels above that zone, making the current spike stand out.
The absence of any meaningful pullback in the net position line indicates continued accumulation. Positioning remains one-sided, with bullish exposure dominating flows.
When positioning becomes this crowded on one side, price moves can accelerate - but the risk of sharp reversals increases if sentiment shifts.
What the TTF Positioning Surge Is Really Signaling
The chart doesn't show price directly, but it reveals something equally important: how capital is aligning ahead of expected moves. The scale of the net long position suggests funds anticipate tighter conditions in the gas market.
Recent developments across energy markets reinforce this theme. Brent Oil Calendar Spread Hits Record $25 Backwardation in March 2026 highlights tightening conditions in crude, while Brent Oil Tops $100 as Hormuz Closure Puts 20% of Global Supply at Risk underscores how sensitive energy flows are to geopolitical disruption. Meanwhile, Helium Prices Double as Qatar's 33% of Global Supply Goes Offline shows how quickly supply shocks can ripple across commodity markets.
For now, TTF gas positioning reflects a market leaning heavily in one direction. The conviction is clear - the question is how long it can hold.
 Usman Salis