 Alex Dudov
⬤ Silver is flashing historically stretched momentum signals even after a sizeable pullback from its January peak. February marked the 10th consecutive up month for Silver - a streak the commentary says has not occurred before, despite an estimated 40% drawdown from the January high. The long-term chart spanning back to the 1970s shows the metal pushing higher into late February with momentum indicators reaching extreme territory, similar to patterns discussed in Silver Rallies 64% in Seven Weeks as RSI Reaches 91.22.
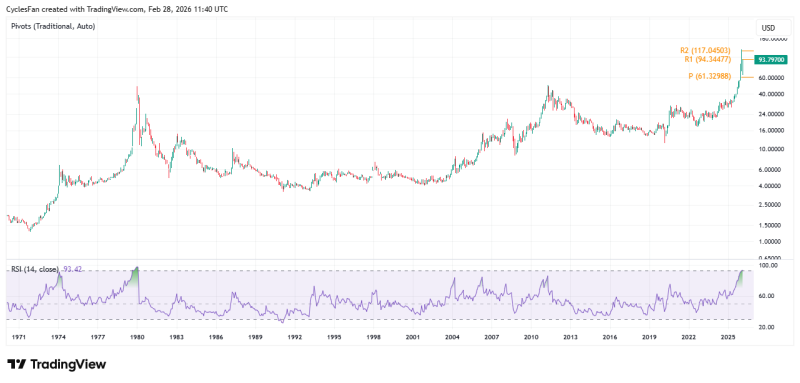
⬤ The key data point is the 14-month RSI reading of 93.42, shown on the lower panel, which notes is the highest level since the 1980 top. On the price panel, traditional pivot levels are displayed with R1 near $94.34, R2 near $117.05, and the central pivot around $61.33, while the latest price marker sits around $93.78. That places Silver just below the first resistance band, aligning with the commentary's focus on whether RSI can push above 94 in the near term, as explored in Silver Hits $93.50 as Market Approaches 215% Deviation Above 50-Month Average.
⬤ The chart context supports why 94 is being treated as a key threshold, with RSI already near the upper extreme and price sitting just beneath the highlighted resistance level, potentially setting up a rally back toward the January high.
⬤ This matters because readings near prior historical extremes can coincide with heightened volatility and sharper reactions around key levels. With Silver pressing into the low-$90s and RSI near 93.42, the next move around the 94 area could shape whether momentum extends further or pauses after an unusually persistent monthly advance, a scenario detailed in Silver Price Analysis: Bear Flag Pattern Signals Potential Drop from $94 Level.
 Alex Dudov


