 Usman Salis
⬤ Silver climbed to a weekly high near $93.50 this week, pushing right up against its first yearly resistance around $94. What makes this move particularly significant is where it sits relative to long-term averages—the metal is now trading about 215 percent above its 50-month moving average. That's an extreme stretch by any measure, and it puts silver in territory where big directional moves tend to happen.
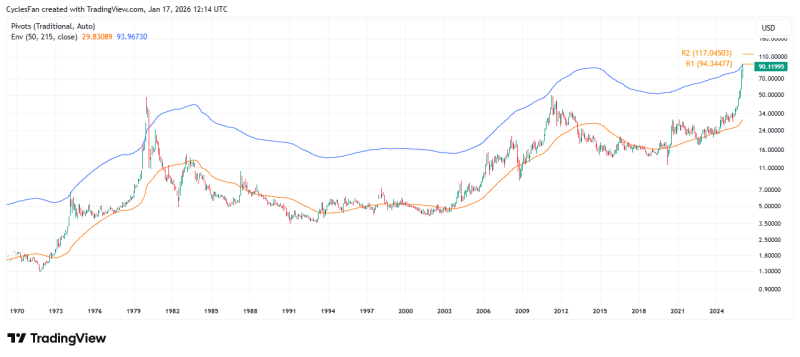
⬤ This kind of deviation has only shown up twice before in modern history. The first time was February 1974, and the second came during the dramatic run from October 1979 through January 1980. Both periods marked major inflection points where silver's long-term trend shifted decisively. The current setup mirrors those conditions, suggesting we're at another make-or-break moment rather than business as usual.
⬤ The technical picture shows two key resistance zones ahead. The first sits right where we are now at $94, and the second is further up around $117. That higher level lines up with the kind of blow-off move silver made in 1980, when it transitioned from a steady rally into a rapid acceleration. Whether history repeats itself depends entirely on how price behaves at these levels over the coming weeks.
⬤ For traders and investors, the message is clear: silver isn't in a neutral zone anymore. The market is either going to roll over from these extended levels or punch through toward that second resistance zone. Either way, the extreme positioning means the next major trend is likely being decided right now, making current price action around $94 critical to watch.
 Usman Salis


