Alex Dudov
⬤Silver is back in focus after clearing a resistance trendline that held for nearly a decade. The long-term chart shows how the metal broke above a rising resistance line originating around 2015, triggering a sharp rally. The breakout came in September 2025, after which silver advanced quickly and has since been stabilizing near elevated levels, consistent with typical post-breakout behavior in commodity markets.
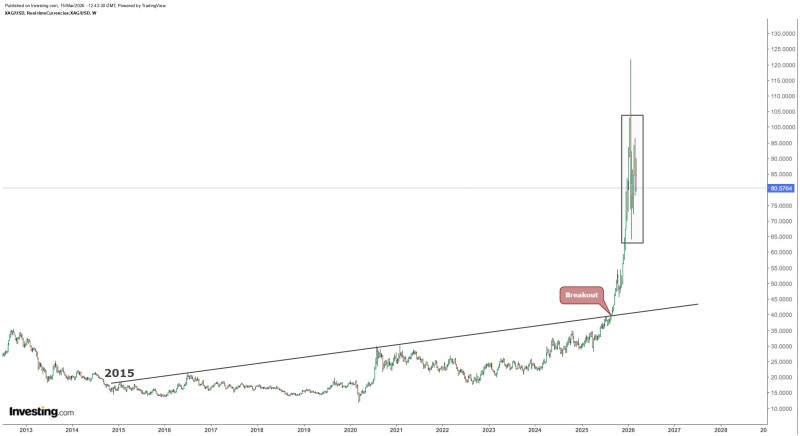
⬤After the structural breakout, silver surged above $100 per ounce and briefly tested the $120-$130 range before pulling back into a consolidation zone near $80-$89. This kind of broad sideways phase is common after large technical moves, as markets digest the rally and liquidity redistributes. The highlighted range on the chart suggests the market is taking a breath before its next directional decision.
⬤The macro backdrop continues to support precious metals. Economic uncertainty, geopolitical tensions, and persistent inflation concerns have historically driven demand for safe-haven assets. Silver's multi-year rally between 2022 and 2025 reflects that dynamic, with global demand rising steadily. Analysts tracking silver near the $94 resistance zone note potential upside targets toward $98-$116, reinforcing the case that consolidation here may be a launchpad rather than a ceiling.
⬤If silver holds above the former resistance zone, the broader bullish structure remains intact. Technical setups like this have frequently preceded new upward impulses in commodity markets, particularly when macroeconomic conditions favor hard assets. A breakout pattern pointing toward $100-$103 has already been identified by multiple analysts, highlighting how current consolidation could define the next leg higher.
 Alex Dudov