 Victoria Bazir

⬤ Silver is consolidating on the hourly chart after a strong rebound from the 84 price region. The metal has stabilized within the 88-89 resistance zone, compressing inside the Fibonacci 0.618-0.786 retracement band - an area that typically signals a key directional decision for XAG/USD.
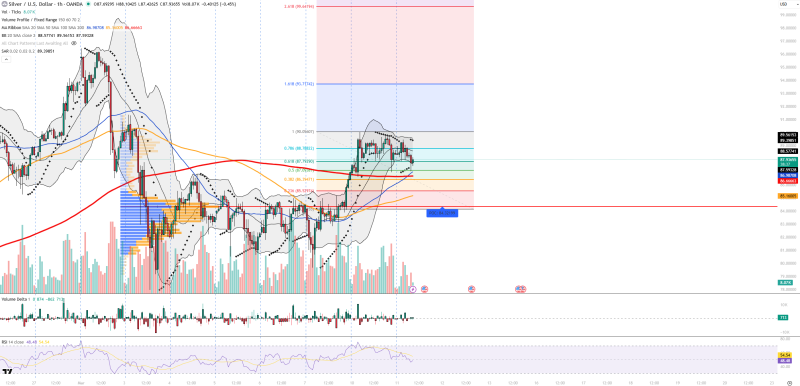
⬤ The upward move from 84 has paused as price tests resistance at 88.77 and 89.39. The Relative Strength Index sits near 48, indicating weakened momentum and a market in balance. Trading volume has also declined since the rally, consistent with consolidation where buying and selling pressure become more evenly matched.
⬤ Additional indicators reinforce the compression thesis. Bollinger Bands are narrowing, pointing to reduced volatility and a tightening price range. The Parabolic SAR shows dots above current price, flagging short-term downward pressure. The Volume Profile places the Point of Control near 84.32 - a key liquidity zone from prior high-activity trading sessions. Support sits at 87.59, 86.99, 86.66 and 85.16, while resistance holds at 88.77, 89.39, 90.05 and 93.77.
⬤ Broader macro dynamics remain a factor. Silver responds to U.S. dollar moves, geopolitical developments, and global growth expectations. As both a safe-haven and industrial metal, it regularly reflects shifting risk sentiment. Analysts tracking similar setups - including the resistance cap near current levels - have noted that a sustained break above 89.39 could open the path toward 90.05 and beyond, while failure to hold 87.59 may trigger a deeper pullback toward the 85 range.
⬤ With silver trading inside the current Fibonacci band, price behavior around nearby resistance and support will likely determine whether the market resumes its upward trend or enters a deeper corrective phase.
 Victoria Bazir


