 Marina Lyubimova

Inflation may be closer to a turning point than markets expect, as past oil shock cycles show that price pressures tend to accelerate sharply once supply disruptions take hold. As Lukas Ekwueme highlighted, the current shock is broader than previous episodes - increasing the risk that inflation is being systematically underestimated.
When Oil Shock Inflation Rapidly Reprices
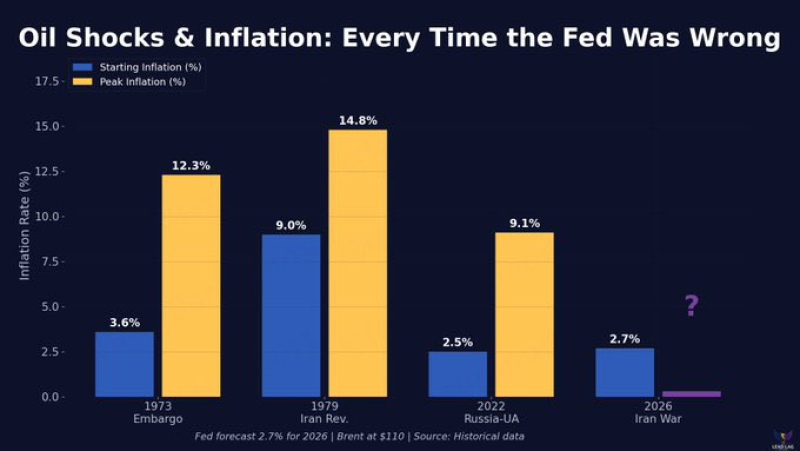
The chart compares major oil shock periods - 1973, 1979, and 2022 - by mapping starting inflation against peak inflation. Each episode follows a consistent structure: a relatively moderate starting point followed by a sharp and outsized surge.
- 1973: inflation rose from ~3.6% to 12.3%
- 1979: inflation pushed from ~9.0% to 14.8%
- 2022: inflation climbed from 2.5% to 9.1%
The pattern is clear: once inflation begins to move, it does not rise gradually. It accelerates and expands well beyond its starting level, creating a widening gap between expectations and realized outcomes.
The Missing Ceiling in the 2026 Oil Shock Setup
The projected 2026 scenario, tied to an Iran-related shock, shows a starting inflation rate near 2.7%. Unlike prior periods, the peak is left undefined - marked with a question mark rather than a number.
That absence of a projected ceiling is itself a signal. Historically, inflation peaks during supply shocks have consistently exceeded expectations, and the lack of a defined endpoint reflects genuine uncertainty rather than stability. The chart's structure suggests that early-stage inflation readings routinely fail to capture the full magnitude of what follows.
Oil-Powered Growth Risk: $10/Barrel Rise Could Cut GDP 0.1 and Push Inflation to 2.7% shows how even incremental oil price increases translate directly into inflation pressure - and why the starting point of 2.7% in the current scenario may prove to be just that: a starting point.
A Broader Oil Shock Across Multiple Inputs
The current disruption is not limited to oil - it also includes gas, fertilizer, and helium. While previous cycles were heavily oil-driven, the current environment reflects a wider supply constraint across key inputs. This creates a compounding effect where multiple sources of pressure interact rather than move independently, building more persistently once momentum develops.
The current disruption spans gas, fertilizer, and helium alongside oil - multiple sources of pressure interacting rather than moving independently.
Brent Oil Tops $100 as Hormuz Closure Puts 20% of Global Supply at Risk captures how the supply shock is already showing up in benchmark pricing, while WTI Crude Tops $100: Oil Prices Signal Rising Market Risk reinforces how elevated energy prices are amplifying the broader macro risk environment.
Why the Oil Shock Pattern Still Matters for SPY
For SPY stock and the broader S&P 500, inflation shocks have historically triggered repricing across equities. Rising inflation tends to reshape expectations and shift market positioning - often increasing volatility before a new equilibrium is found.
The key takeaway from the current setup mirrors what the chart shows across three prior cycles: starting conditions rarely define the outcome. Once inflation tied to a supply shock begins accelerating, it tends to overshoot what markets initially anticipate - and the gap between the starting point and the eventual peak is where the real damage to equity valuations tends to occur.
 Marina Lyubimova


