 Usman Salis
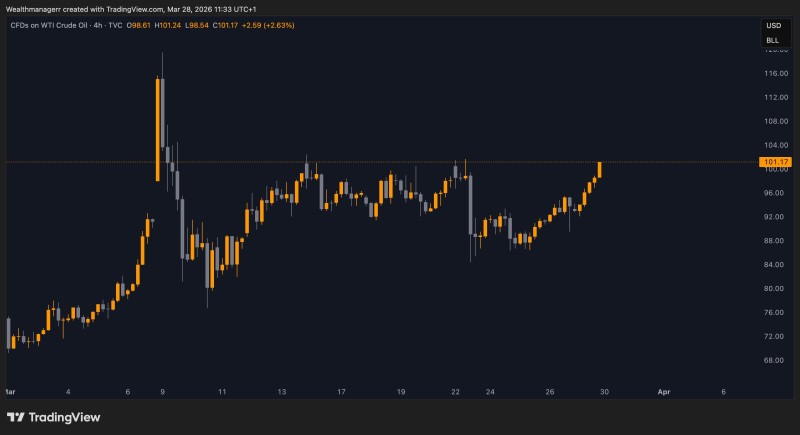
Oil prices have moved back above the $100 mark, drawing renewed attention to potential risks across global markets. According to Wealthmanager, the latest 4-hour candle close suggests further upside momentum, with price action pointing to continued strength above this key level.
The chart shows WTI crude steadily advancing toward the $100-$101 area, with the most recent candle closing firmly above this psychological threshold. This confirms a breakout from prior consolidation, where price had repeatedly approached but failed to sustain above this level.
The Oil Breakout Above $100 That Traders Are Watching
The move higher follows a period of choppy price action, with multiple attempts to push upward before finally establishing acceptance above $100. This aligns with the warning that the latest close signals potential continuation.
The latest close signals potential continuation - and this is the move traders have been waiting for.
Price action on the chart reflects a gradual build-up rather than a sharp spike. After earlier volatility, oil stabilized and began forming higher lows, leading into the current push above resistance. The latest candles show consistent upward movement without immediate rejection, indicating that buyers remain in control in the short term.
Similar setups in oil markets have previously led to extended rallies once key resistance levels are reclaimed, particularly when momentum builds into the breakout. You can see how this pattern played out earlier when WTI crude oil surged above $84 as momentum built - a move that preceded further strength across energy markets.
Why the $100 Oil Level Carries Such Weight
The $100 level carries strong technical and psychological significance. Holding above it signals a shift in market structure, where previous resistance turns into a potential support zone.
Sustained high oil prices carry real risks tied to rising costs and economic pressure - this isn't just a chart story.
The positioning above $100 reinforces the idea that oil has entered a higher pricing regime. This aligns with broader energy market behavior, where elevated oil prices often influence inflation dynamics and economic expectations. The pattern is familiar - back when WTI oil hit $114 amid geopolitical risks, markets faced a similar reckoning with the downstream effects of sustained high energy costs.
The $100 Oil Signal: What Happens Next
The key focus now is whether oil can sustain its position above $100. If price continues to hold and build above this level, the structure supports further upside continuation. The current trend shows no clear rejection, and momentum remains aligned with the breakout.
The chart reflects strength rather than exhaustion - and that distinction matters for everyone watching this market.
For context on how market participants are positioning around this move, oil market options skew has spiked to signal upside risk - a separate but reinforcing data point that aligns with the current price action. For now, the chart reflects strength rather than exhaustion, keeping attention firmly on whether oil can maintain this level and extend the move higher.
 Usman Salis


