Saad Ullah

The oil market is sending two very different signals at once - and that gap is getting harder to ignore. As Logan Weaver noted, physical crude is trading as if supply is under real stress while futures continue to price a much calmer scenario. The chart reinforces why this matters: the Strait of Hormuz remains one of the most critical chokepoints in global energy markets, handling a massive share of oil and LNG flows.
The Chokepoint Driving the Oil Market Narrative
The image highlights the scale of dependency on the Strait of Hormuz. Roughly 30% of global seaborne oil trade and 20% of LNG shipments pass through this narrow corridor. In 2024 alone, it carried about 20.3 million barrels per day of oil and petroleum products alongside 290 million cubic meters of LNG.
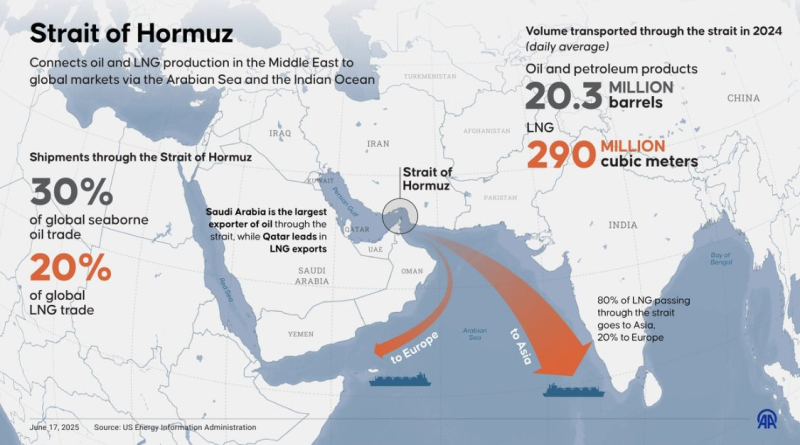
The directional flows also matter. Around 80% of LNG moving through the strait heads to Asia, with the remainder going to Europe. This makes the region not just strategically important but structurally embedded in global supply chains - any disruption here immediately translates into pricing pressure across multiple markets simultaneously.
30% of global seaborne oil and 20% of LNG passing through a single corridor is not a supply concentration risk - it is a systemic vulnerability, and the physical market is pricing that reality while futures are not.
Brent Oil Tops $100 as Hormuz Closure Puts 20% of Global Supply at Risk documented the initial price response when Hormuz disruption risk first emerged as a serious market factor - providing the baseline from which the current physical-futures divergence has widened considerably.
Where Real Oil Barrels Diverge From Paper Markets
The core issue is the widening gap between physical and futures pricing. Dated Brent has traded as high as $120-$150 while futures have remained closer to $100. This divergence is unusual because futures markets typically lead expectations - in this case, however, the physical market is reacting faster, pricing in immediate supply constraints tied to transport risk through Hormuz.
That creates a situation where one side of the market is likely misaligned. Physical markets reflect real scarcity while futures reflect expectations that conditions will normalize. When the gap becomes this wide, it tends to resolve through sharp repricing rather than gradual convergence.
Brent Oil Hits $141 as Physical Prices Break Away From Futures shows the upper end of where this physical market repricing has already gone, reinforcing that the divergence being discussed is not theoretical but is already producing historically significant price dislocations in the spot market.
A Oil Market Setup That Extends Beyond Energy
When a single route carries such a large share of global supply, even partial disruption ripples through energy markets and into inflation expectations, growth outlooks, and broader risk assets. The chart makes that transmission mechanism visible by showing exactly how much global flow depends on a corridor that is currently under pressure.
Saudi Exports Surge as Yanbu Rerouting Bypasses Hormuz shows the producer-side response to the disruption - demonstrating that while rerouting is happening, the scale of the Yanbu corridor cannot fully replace Hormuz capacity, which helps explain why physical prices continue to price scarcity even as futures markets remain relatively calm.
The tweet's final point is where the broader risk comes into focus: if futures markets are underpricing the supply shock, the eventual adjustment is unlikely to be gradual. This is not just an oil story. It is a structural vulnerability in global supply - and when pricing signals tied to that system begin to diverge this sharply, markets rarely stay stable for long.
 Saad Ullah