 Eseandre Mordi

Oil markets are sending a signal rarely seen outside of crisis conditions. The price of physical crude has surged to levels not seen since 2008, while futures lag far behind. According to Global Markets Investor, Dated Brent has climbed to $141.37 - a historic divergence that reflects a sharply tightening physical market.
The Breakout That Turned Into Acceleration
The chart shows a clean transition from a stable range into a strong uptrend that rapidly intensified. Through January and February, Brent traded in a relatively narrow band near $60-$70, forming a base with modest fluctuations.
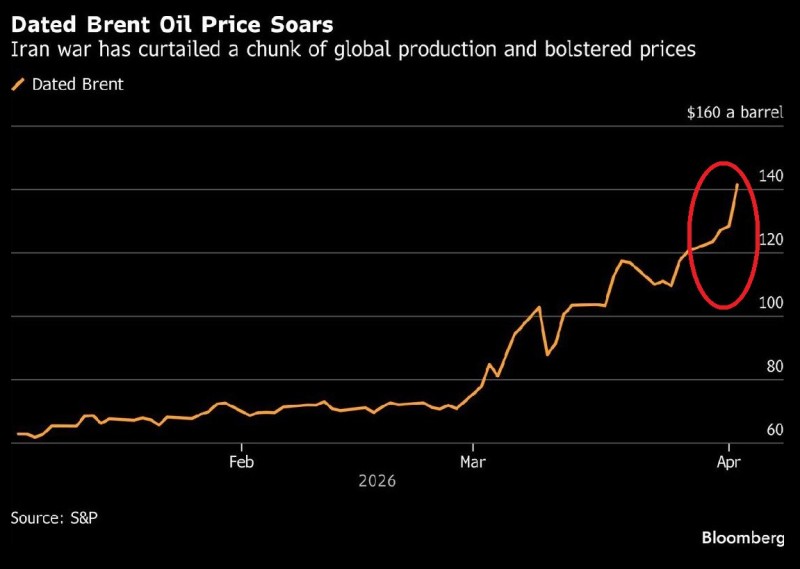
That structure shifted in March, when price began printing higher highs and higher lows - the start of a sustained bullish trend. The move then accelerated sharply, breaking above $100 and continuing higher without meaningful consolidation. The most recent leg shows a near-vertical extension toward the $140 area, reflecting momentum expansion rather than a balanced trend, with little evidence of resistance slowing the move.
A $34 Gap That Signals Stress in the System
A key detail here is the widening disconnect between physical oil and futures markets. While Brent futures are trading near $107, the physical benchmark has surged above $141 - creating a gap of roughly $34.
Buyers in the physical market are bidding aggressively for available barrels, pushing spot prices far beyond futures pricing.
This divergence means real-world supply conditions are significantly tighter than what financial markets imply. Such dislocations are rare and typically emerge during periods of severe supply imbalance - when scarcity, not equilibrium, is driving price discovery.
When Brent Oil Structure Becomes One-Sided
From a technical analysis perspective, the structure has evolved from a steady uptrend into an impulsive rally. The sequence of higher highs remains intact, but the steepness of the move has increased dramatically. Notably, the chart shows:
- A clean transition from range to trend
- Strong continuation above the $100 breakout zone
- No visible rejection near recent highs
- A sharp final push toward $140 with minimal pullbacks
Price is not rotating between support and resistance - it is climbing with limited interruption.
As Oil Prices Surge as Uptrend Accelerates highlighted, persistent higher highs and limited pullbacks tend to sustain bullish momentum in crude markets. This kind of structure signals that the market is being driven by urgency rather than gradual accumulation.
Price Action Echoing 2008 Crisis Conditions
The current levels place Brent back near territory last seen during the 2008 oil crisis. The chart reinforces this narrative, showing a similar pattern of late-stage acceleration following a prolonged base.
Brent Oil Breaks $110 After 7% Surge in Short-Term Structure Flip showed that once key psychological levels are cleared, price often transitions into aggressive expansion phases rather than consolidation. Brent Oil Jumps Past $110 in Sharp Breakout reinforced the same dynamic - buyers dominate, resistance fails to hold, continuation follows.
This is not a typical rally - it is a market under pressure, where price discovery is being driven by scarcity rather than equilibrium.
The current chart fits squarely within that pattern, but at a much larger scale. With price accelerating and the gap between physical and futures markets widening, Brent is no longer just trending higher - it is moving in a way that reflects structural imbalance in the global oil supply.
 Eseandre Mordi


