Alex Dudov

Gold's long-term uptrend is entering a critical phase. Each consolidation appears larger than the last, and the pattern building right now may be the most consequential one yet. As Rashad Hajiyev outlined in his recent analysis, the structure shows a consistent rhythm of expanding pauses followed by increasingly steep rallies - and the current setup fits that pattern almost perfectly.
Gold's Pattern: Each Consolidation Bigger Than the Last
The chart tells a clear story. Gold advances, pauses, then accelerates - and every cycle is larger than the one before it.
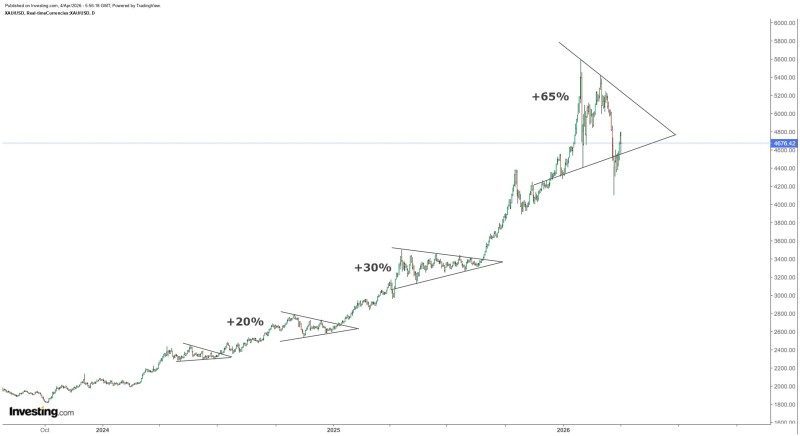
Earlier consolidations preceded gains of roughly 20%. The next phase produced a broader structure that led to a 30% rally. After that came an even stronger move of around 65%, confirming the trend is not just intact but actively accelerating.
The structure shows a pattern of expanding pauses followed by increasingly steep rallies - each new phase builds on the previous one.
This isn't a series of isolated price swings. It's a consistent structural rhythm where momentum compounds over time. The gold triangle pattern tightening near $4,080 is the latest expression of that sequence - and it arrives after the biggest advance yet.
Gold Triangle Compression Zone Builds Near Recent Highs
Price has pulled back from the peak but remains inside the formation, holding above rising support while facing pressure from descending resistance. The result is a compression zone where volatility is shrinking as price approaches the apex of the triangle.
Tightening ranges often precede sharp breakouts once resistance is cleared - similar structures in gold markets have repeatedly preceded major directional moves.
According to gold price analysis tracking the $5,080-$5,120 supply zone, price action remains sensitive to overhead resistance levels. The current triangle formation is the largest consolidation of this entire cycle - which, based on the pattern history, suggests the breakout could be the most powerful one yet.
Broader Gold Trend Remains Structurally Intact
Despite the pullback, the broader trend continues to show higher highs and higher lows across the full timeframe. The current consolidation doesn't break that structure - it reflects a pause within it. Three conditions define the current setup:
- Price remains elevated after a strong rally
- The structure is compressing rather than breaking down
- Resistance is descending while support continues to rise
These conditions typically indicate continuation pressure building within the trend. Importantly, the gold monthly chart and bearish engulfing candle risk signal adds context to the caution warranted here - breakouts from compression structures can resolve in either direction, and the monthly timeframe always carries more weight.
Gold is no longer in a simple trend - it is in an accelerating one, where each rally becomes steeper than the last.
A breakout above the upper boundary of the triangle would confirm continuation and align with the pattern Hajiyev described. As long as price holds above the rising support trendline that defines the lower boundary of the structure, the broader bullish trend remains intact. The current consolidation may not signal exhaustion at all - but rather preparation for a move that could exceed everything that came before it.
 Alex Dudov