 Artem Voloskovets

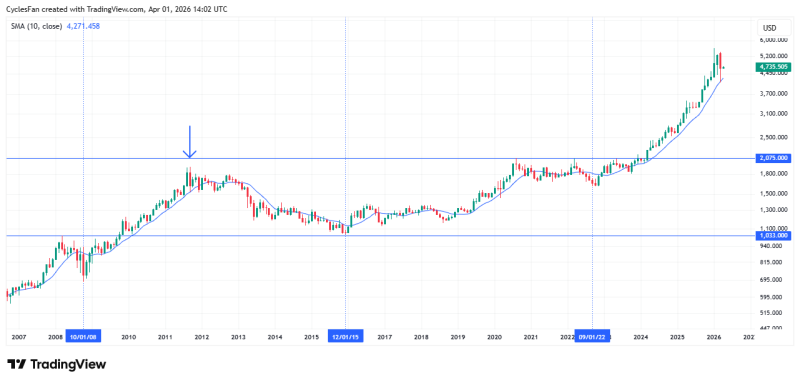
Gold is flashing a potential long-term turning signal after printing a bearish engulfing candle on the monthly chart and reacting sharply at the 10-month moving average. As CyclesFan noted, the March candle closely mirrors the bearish engulfing formation that appeared in September 2011 - a period that marked a major peak and the start of a prolonged decline. The structure now places the broader gold trend at a genuine decision point.
The March candle fully engulfs the prior month's range, signaling a potential shift in momentum control from buyers to sellers.
A Pattern That Echoes the 2011 Gold Peak
The comparison to 2011 is not incidental - it sits at the core of this setup. That year's bearish engulfing formation on the monthly chart led to a multi-year corrective cycle. The current candle replicates that structure almost exactly: the body of March's bar swallows the full range of the previous month, reflecting a decisive shift in who was in control by the close.
This pattern type tends to carry weight on higher timeframes precisely because it takes sustained selling pressure throughout an entire monthly session to produce it. One month of reversal does not confirm a new trend, but it does raise the probability that the prior advance is losing its foundation.
Gold Price Tests the 10-Month Moving Average - Key Level for Long-Term Gold Trends
The chart shows price pulling back into the 10-month moving average at the monthly low, a behavior that directly matches what occurred during the 2011 cycle. This level functions as a long-term structural reference - not a short-term support line, but a dynamic marker of trend health over years, not weeks.
Crucially, price has reached this moving average without confirming a breakdown. That keeps the market in a decision phase rather than a confirmed reversal. Whether gold reclaims ground above this level or continues to press lower in the coming sessions will carry significant weight for long-term positioning. As highlighted in Gold Price Analysis: 8% Correction on the Horizon, technical structures often weaken after extended rallies, leading to corrective phases rather than immediate continuation.
Price reached the 10-month moving average without confirming a breakdown - the market remains in a decision phase, not a confirmed reversal.
Gold Chart Structure Raises Cycle Risk After Multi-Year Rally
The broader structure still reflects a strong multi-year uptrend. That context matters - single candles do not erase long-term momentum, and the bull case for gold has not been structurally invalidated. What the bearish engulfing candle does introduce is a measurable signal of weakening momentum at a historically significant price zone.
Several conditions are now converging that historically precede corrective phases in gold:
- A bearish engulfing candle on the monthly chart
- Price contact with the 10-month moving average at the low
- A structural parallel with the September 2011 peak
- Fragile price action below key resistance levels, as outlined in Gold Holds Weak Structure Below $4,630
None of these signals alone is sufficient for a confirmed reversal. Together, they form a cluster that warrants attention from long-term participants.
Long-Term Gold Outlook: Cycle Low Near $2,100 by 2030
Beyond the immediate chart structure, the analysis outlines a longer-term scenario rooted in cyclical behavior. The thesis suggests that gold could enter a bear market into the next 7-year cycle low, projected around 2030, with a potential downside target near $2,100. That would represent a substantial retracement from current levels and a move consistent in scale with what followed the 2011 peak.
This is not a near-term price call - it is a cyclical framework that uses the current technical signals as its starting point. The bearish engulfing candle and the test of the 10-month moving average serve as the early evidence base for that thesis, not its confirmation. As noted in Gold Price Forms Double Top - Key Support at $4,220, recent price action has already begun showing signs of topping structure at elevated levels.
The current signals serve as the early evidence base for a cyclical bear market thesis into 2030 - not its confirmation.
For now, gold sits at a critical inflection. The trend has not reversed, but the structure has weakened. The next moves around the 10-month moving average will determine whether this is a temporary correction or the beginning of a longer cycle shift.
 Artem Voloskovets


