 Alex Dudov

⬤ Gold is under short-term bearish pressure, trading near the $5,020 level after a sharp drop. The market remains below a clearly defined premium supply zone on the hourly chart, and the bearish bias stays intact as long as price holds under that overhead resistance.
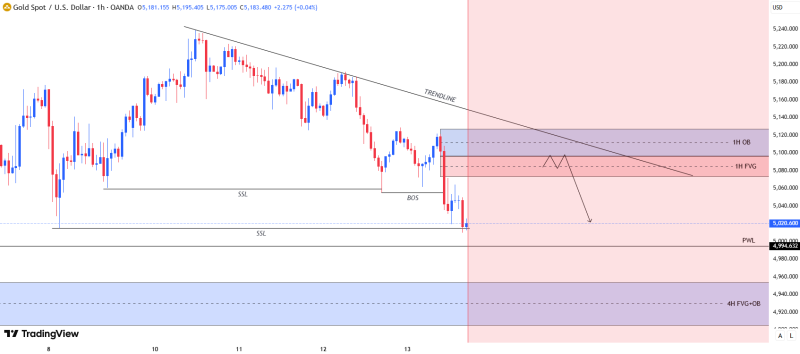
⬤ The chart shows gold building a sequence of lower highs along a descending trendline. After breaking structure near the mid-$5,100 area, price pushed aggressively into sell-side liquidity near $5,020. The $5,080-$5,120 supply zone overlaps with a one-hour order block and fair value gap, making it a technically significant area where sellers stepped in with force. Gold Caught Between Trendline Support and $5,250 Resistance explored how compression between trendlines and resistance zones tends to shape short-term direction.
⬤ A shift in short-term structure would require gold to reclaim the order block and fair value gap region and break the trendline with conviction. Gold Tests $5,180 Resistance as Hourly Recovery Rally Builds noted how reclaiming key resistance zones can flip momentum and fuel broader recovery moves in gold markets.
⬤ The current price structure highlights how supply zones and descending trendlines define short-term sentiment. Selling pressure tends to persist as long as gold stays below major supply regions. Gold Price Analysis: Triangle Breakout Pattern Could Target $7,000 by Mid-May also noted that consolidation around the $5,100 area can precede significant directional moves once key levels are reclaimed. Whether XAUUSD extends its decline or transitions into recovery will depend on how price interacts with these critical zones in the sessions ahead.
 Alex Dudov


