 Saad Ullah

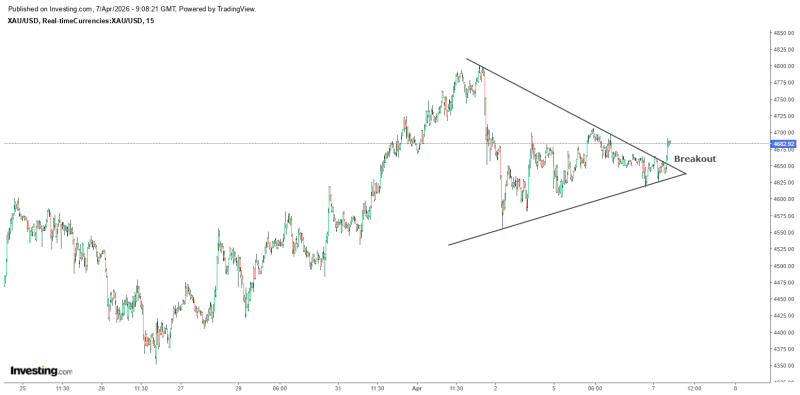
Gold is entering a decisive phase as price action tightens into a clear triangular formation. Analyst Rashad Hajiyev noted that the week-long structure is approaching resolution, with the next move likely to define short-term direction across XAU/USD.
The chart shows gold forming a symmetrical triangle after a prior upward move. Price action is defined by a series of lower highs and higher lows, creating a tightening range. This type of structure reflects consolidation rather than trend reversal. Volatility contracts as both buyers and sellers lose momentum, typically leading to a breakout once the range fully compresses.
The week-long triangular structure is now approaching resolution, with the next move likely to define short-term direction.
Similar setups have recently appeared across gold markets, where tightening ranges preceded strong directional moves, particularly when price becomes constrained between trendlines.
Where Gold Structure Meets Decision Point
Gold is currently trading near the upper boundary of the triangle, around the mid-range of the formation. This area has acted as a pivot, with repeated reactions confirming its importance. The key technical dynamics visible on the chart:
- Descending resistance pressing price lower
- Ascending support holding pullbacks higher
As price approaches the apex, the range narrows significantly. This compression suggests that the market is nearing a decision point rather than continuing sideways. Historically, the longer the compression phase, the stronger the eventual move once boundaries break.
Volatility contracts inside the triangle as both buyers and sellers lose momentum - a breakout becomes inevitable once the range fully compresses.
Higher Lows Keep Gold Breakout Pressure Building
One of the defining features of the current structure is the consistent formation of higher lows. Each pullback is being bought earlier than the previous one, indicating underlying demand. At the same time, resistance continues to cap upside attempts, preventing expansion. This balance between buyers and sellers is what creates the triangle pattern.
Market behavior in similar conditions shows that sustained pressure within narrowing ranges often leads to sharp moves once resistance or support is broken. XAU breakout scenarios targeting $7,000-$8,000 have already been mapped by analysts watching these structural conditions evolve.
Sustained buying pressure within a narrowing range is precisely the setup that historically precedes the sharpest directional moves in gold.
Gold Breakout Confirmation Becomes the Only Signal That Matters
With price nearing the apex of the formation, the focus shifts entirely to confirmation. The structure visible on the chart can be summarized as:
- Tight consolidation inside converging trendlines
- Reduced volatility as price compresses
- Imminent breakout setup forming
A move beyond the triangle boundaries will likely define the next phase, while continued rejection keeps price trapped inside the range. For context, gold previously tested the $5,000 support zone after a sharp selloff - a level that now anchors the broader technical picture. For now, gold remains in consolidation - but not for long.
 Saad Ullah


