 Saad Ullah

⬤ Gold opened the session under pressure and quickly tested the March 3 low near the $5,000 support zone. After the early selloff, price stabilized around $5,018, attempting to hold above the tested level. The metal has largely moved sideways for roughly two weeks, with limited directional momentum across the precious metals market.
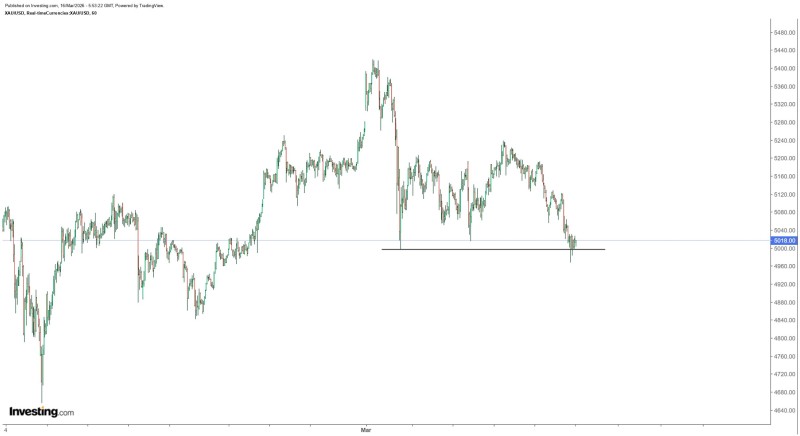
⬤ The chart shows gold previously rallying above the $5,400 region before a sharp pullback pushed it into a choppy consolidation phase. Since that decline, XAU/USD has repeatedly revisited the $5,000 area, suggesting the level has become a key technical reference point. Analysts previously noted in Gold caught between trendline support and $5,250 resistance that gold tends to compress between defined levels before a decisive move develops.
When markets revisit recent lows, traders watch for confirmation that the level can hold before committing to a directional bias.
⬤ The March 3 low now acts as a short-term technical floor. Earlier Tradable coverage in Gold at pivotal H4 trend line: $4,600 and $5,600 in focus also flagged the $5,000 region as a key support cluster, reinforcing its importance in shaping near-term price behavior.
⬤ The broader significance of the current structure lies in how markets behave during prolonged sideways phases. When assets trade flat for multiple weeks, well-defined support and resistance levels gain greater weight. As highlighted in Gold price analysis: $5,100 ascending triangle signals breakout, extended consolidation in gold often precedes a larger directional move once a key level breaks. The $5,000 zone remains the most closely watched level, and how price reacts here could set the tone for the next leg in the precious metals market.
 Saad Ullah


