 Sergey Diakov

⬤ XAU/USD is sitting at a technically sensitive spot on the four-hour chart, with price testing a key red ascending trend line. A downward break from this level could ramp up selling pressure and drag gold back toward the $4,600 region. If price holds above the trend and keeps its recent structure intact, the road toward $5,450 to $5,600 opens up — though that's also where fresh selling pressure may kick in.
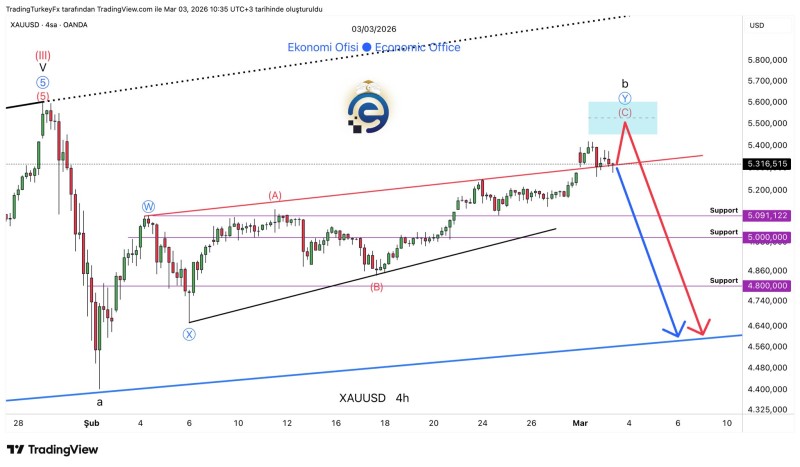
⬤ The chart shows XAU/USD hovering near $5,316, with well-defined horizontal support zones around $5,091, $5,000, and $4,800. The red trend line is acting as dynamic support while overhead resistance clusters in the $5,450 to $5,600 band. A high-volume breakout above those levels could push the move all the way to $6,500. Prior coverage also flagged how gold approached a key resistance area near $5,043 that could act as a directional pivot, underscoring just how important those nearby supply zones really are.
A break above $5,600 with strong volume could extend the move all the way toward $6,500 — but first, gold has to prove it can hold its trend.
⬤ Earlier analysis showed gold has been holding a bullish channel while testing the $4,580 to $4,590 support zone — a sign that lower support areas can temporarily stabilize price before the next move unfolds. A separate update noted that XAU/USD traded around the $4,570 support level, which was seen as decisive for the next directional move — reinforcing how technical reactions near defined levels tend to shape short-term momentum.
⬤ With XAU/USD hugging its red trend line, the market is at a clear inflection point. A sustained break below support could build bearish momentum toward $4,600, while holding above trend keeps the higher resistance targets firmly in play. The dense clustering of support and resistance zones on the H4 chart makes the next move particularly significant for gold's short-term direction.
 Sergey Diakov


