 Eseandre Mordi

⬤ Gold (XAU) is hovering just underneath a significant yearly resistance barrier after last week's close landed right below the first resistance zone around $5,043. The weekly TradingView chart shows price action pushing into the R1 area at $5,043.628, with the latest reading near $5,042.740. This positioning places the yellow metal at a clear inflection point that could shape its next major move.
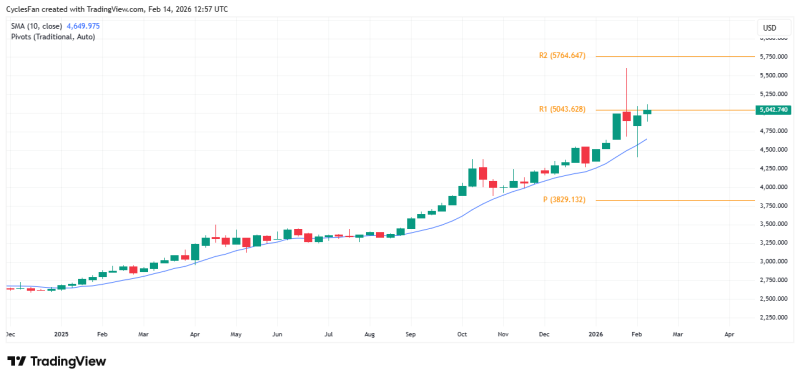
⬤ The outlined scenario remains conditional rather than certain. Should gold manage to post a weekly close above the $5,043 mark by the end of next week, the technical outlook points toward a potential new all-time high before Q1 wraps up. The analyst's chart also identifies a second yearly resistance sitting at $5,764.647, which would serve as an additional upside target if the initial breakout actually materializes. The current structure keeps focus on that first decisive close above resistance instead of assuming continuation is guaranteed.
⬤ With the $5,043 level functioning as the immediate decision point, recent coverage from TheTradable has similarly centered on gold's behavior around major round numbers and resistance tests. Related analysis includes Gold nears 5,043 resistance as 14-week cycle high approaches, Gold volatility drops to multi-week lows with no clear pattern at 5000, and Gold holds ascending channel after 3-month bullish climb. These pieces frame the market around clearly defined technical zones without treating a breakout as inevitable.
⬤ The upcoming weekly close now stands as the critical confirmation point in this technical setup. A close above $5,043 resistance would lend support to the Q1 all-time high scenario, while failure to push through would keep gold capped below that barrier. In that case, the $5,764 level remains a conditional target rather than an active trajectory, leaving the metal's next major move dependent on whether buyers can force a decisive weekly breakout above current resistance.
 Eseandre Mordi


