 Saad Ullah

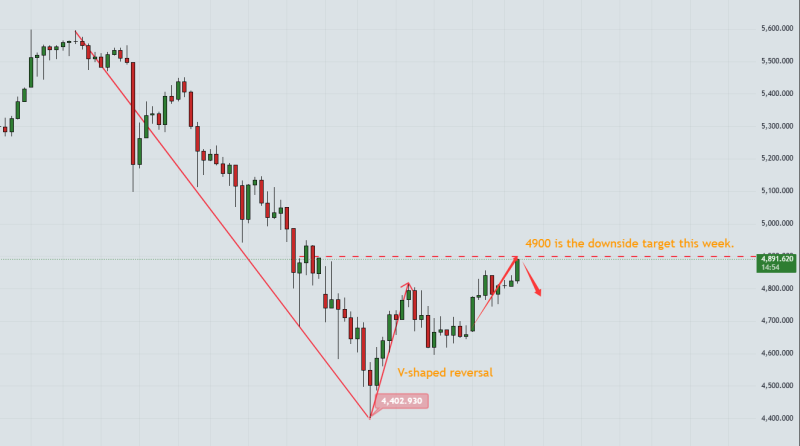
⬤ Gold prices rebounded modestly after a steep decline, recovering above the $4,800 level following a sharp drop that formed a V-shaped reversal from lows near $4,400, as shown on the hourly chart. This move represents the first rebound since the recent selloff, with price now approaching a key resistance zone between $4,890 and $4,900, highlighted on the chart as a critical area where selling pressure may re-emerge.
⬤ Despite the recovery, the broader structure remains corrective. The chart shows that gold has failed to establish a clear break above the resistance line near $4,900, a level that previously acted as support before flipping into resistance. The rebound appears to be a reaction to oversold conditions rather than the start of a new bullish trend, suggesting that the dominant downward momentum hasn't been invalidated yet.
⬤ On the hourly timeframe, the $4,890–$4,900 zone also lines up with an unfilled gap created during the prior plunge, reinforcing its technical significance. The price reaction near this area shows hesitation, with the chart pointing to possible renewed downside if resistance holds. In this scenario, gold could retreat toward the $4,780–$4,700 area, which aligns with near-term downside targets visible on the chart.
⬤ This setup matters because gold remains highly sensitive to short-term technical levels following periods of elevated volatility. With price stalling near resistance after a rapid rebound, upcoming sessions will likely determine whether the move turns into consolidation or resumes the prevailing downward correction.
 Saad Ullah


