 Saad Ullah

Gold (XAU/USD) is showing early signs of exhaustion after its recent rally. Price action has formed a double top pattern near $4,375 and pulled back toward the $4,220 support zone.
Technical Breakdown
This setup was anticipated by Turkish analyst finansal TRader, who identified bearish signals including H1 engulfing candles, H4 pinbars, and momentum divergence.
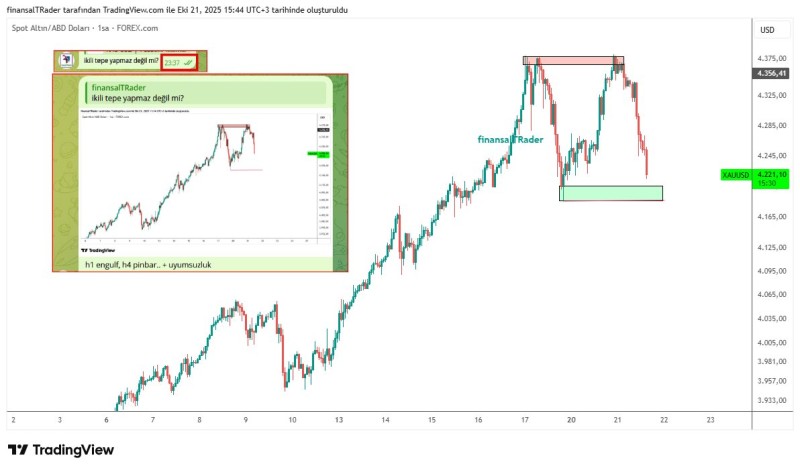
After weeks of gains, gold's rally appears to be pausing. The chart shows a clear double top structure with both peaks around $4,375 — a classic reversal signal that suggests buyers are losing momentum. Lower timeframe patterns like bearish engulfing candles and pinbars confirmed the shift, while divergence between price and momentum indicators hinted at weakening strength. These signals provided early warning before the pullback occurred.
The resistance zone sits between $4,360 and $4,375, where price was rejected twice. Support is now at $4,200–$4,220, marked by a green zone on the chart where buyers may step in. If gold breaks below $4,200, the next downside targets are $4,160 and $4,100. Holding above this level could spark a bounce toward $4,300–$4,350.
Market Context
This pullback comes as the U.S. dollar strengthens and Treasury yields rise, both of which tend to weigh on gold. Profit-taking after record highs is also playing a role. Still, the long-term outlook for gold remains positive, supported by central bank buying, inflation concerns, and geopolitical tension.
 Saad Ullah


