 Usman Salis

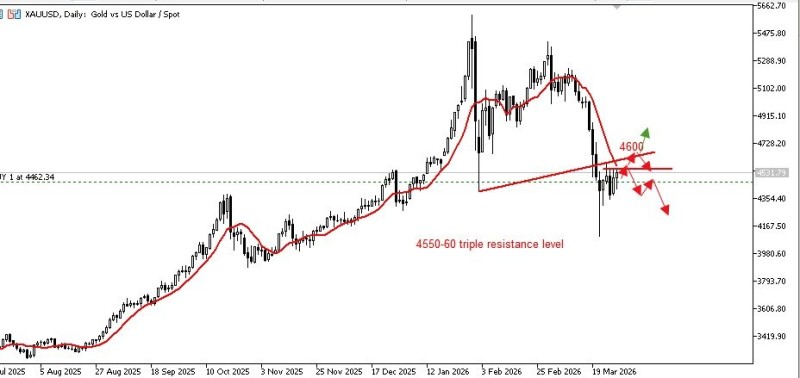
Gold continues to trade in a fragile technical structure after breaking below a key moving average, with price action reflecting a market still under pressure. According to XAUUSD (Gold) - Traders, the daily chart shows gold entering a correction phase, with the broader trend remaining bearish despite a short-term rebound.
The 100-day moving average now acts as resistance near $4630, while resistance zones in the $4,570-$4,600 region have repeatedly capped upside attempts. Although gold found support near the 200-day moving average, the rebound has not produced a confirmed reversal signal.
Price continues to show weakness, with the structure reflecting a corrective phase rather than a new uptrend.
The Breakdown That Defined Gold's Current Trend
The chart highlights a decisive move below the 100-day moving average, reinforcing seller control across the board. Momentum indicators further support this view - the MACD remains below the zero line, signaling persistent bearish pressure, while the RSI has rebounded above 30 but stays in a weak zone, suggesting limited upside strength.
Gold Breaks Triangle Pattern With $4830 Target provides additional context on how the broader pattern unfolded before the current correction took hold.
The MACD remains below the zero line, while the RSI stays in a weak zone - both pointing to limited recovery potential in the near term.
Gold's Key Price Levels: $4630 Resistance and $4300 Support
The current setup places gold between clearly defined levels. Resistance remains near $4630, while downside targets sit at $4380 and $4300, consistent with recent technical structures where support zones determine the next directional move.
Price action suggests a range-bound environment where neither bulls nor bears have taken full control. The inability to reclaim resistance keeps upside limited, while support continues to act as a temporary floor. For more on recent resistance behavior, see Gold Faces $4600 Resistance After $4660 High.
What Gold Traders Are Watching Below $4630
The market reflects a classic battle between bulls and bears, with volatility and indecision dominating short-term price action. When gold loses key support zones, downside momentum can accelerate quickly - reinforcing the importance of the current $4380-$4300 range.
When gold loses key support zones, downside momentum can accelerate - making the current levels among the most watched in the near-term outlook.
In the near term, gold is likely to remain within this range until a decisive move occurs. A break above $4630 could open the path toward higher levels, while a move below support would confirm continuation of the bearish trend. Traders watching for early signs of that scenario can reference Gold Breaks Below $4450 as Selling Pressure Builds for historical precedent.
 Usman Salis


